이번 포스팅은 Karpenter 설치다.
설치하다 막히면 가이드를 보자.
https://karpenter.sh/v0.27.3/getting-started/migrating-from-cas/
karpenter 를 설치하기 전에 먼저 셋팅해야 할것들이 있다.
CLUSTER_NAME=myeks # your clouster name
AWS_PARTITION="aws" # aws or aws-gov or aws-cn
AWS_REGION="$(aws configure list | grep region | tr -s " " | cut -d" " -f3)"
OIDC_ENDPOINT="$(aws eks describe-cluster --name ${CLUSTER_NAME} \
    --query "cluster.identity.oidc.issuer" --output text)"
AWS_ACCOUNT_ID=$(aws sts get-caller-identity --query 'Account' \
    --output text)
export KARPENTER_VERSION=v0.27.3 # latast version
환경 변수 설정이다.
클러스터 이름 / 리전 / OIDC ENDPOINT / 어카운트 넘버 / karpenter 버전이 그것이다.
Karpenter 를 설치할때는 많은 권한을 요구로 한다.
echo '{
    "Version": "2012-10-17",
    "Statement": [
        {
            "Effect": "Allow",
            "Principal": {
                "Service": "ec2.amazonaws.com"
            },
            "Action": "sts:AssumeRole"
        }
    ]
}' > node-trust-policy.json
aws iam create-role --role-name "KarpenterNodeRole-${CLUSTER_NAME}" \
    --assume-role-policy-document file://node-trust-policy.json
aws iam attach-role-policy --role-name "KarpenterNodeRole-${CLUSTER_NAME}" \
    --policy-arn arn:aws:iam::aws:policy/AmazonEKSWorkerNodePolicy
aws iam attach-role-policy --role-name "KarpenterNodeRole-${CLUSTER_NAME}" \
    --policy-arn arn:aws:iam::aws:policy/AmazonEKS_CNI_Policy
aws iam attach-role-policy --role-name "KarpenterNodeRole-${CLUSTER_NAME}" \
    --policy-arn arn:aws:iam::aws:policy/AmazonEC2ContainerRegistryReadOnly
aws iam attach-role-policy --role-name "KarpenterNodeRole-${CLUSTER_NAME}" \
    --policy-arn arn:aws:iam::aws:policy/AmazonSSMManagedInstanceCore
aws iam create-instance-profile \
    --instance-profile-name "KarpenterNodeInstanceProfile-${CLUSTER_NAME}"
aws iam add-role-to-instance-profile \
    --instance-profile-name "KarpenterNodeInstanceProfile-${CLUSTER_NAME}" \
    --role-name "KarpenterNodeRole-${CLUSTER_NAME}"
cat << EOF > controller-trust-policy.json
{
    "Version": "2012-10-17",
    "Statement": [
        {
            "Effect": "Allow",
            "Principal": {
                "Federated": "arn:aws:iam::${AWS_ACCOUNT_ID}:oidc-provider/${OIDC_ENDPOINT#*//}"
            },
            "Action": "sts:AssumeRoleWithWebIdentity",
            "Condition": {
                "StringEquals": {
                    "${OIDC_ENDPOINT#*//}:aud": "sts.amazonaws.com",
                    "${OIDC_ENDPOINT#*//}:sub": "system:serviceaccount:karpenter:karpenter"
                }
            }
        }
    ]
}
EOF

aws iam create-role --role-name KarpenterControllerRole-${CLUSTER_NAME} \
    --assume-role-policy-document file://controller-trust-policy.json

cat << EOF > controller-policy.json
{
    "Statement": [
        {
            "Action": [
                "ssm:GetParameter",
                "ec2:DescribeImages",
                "ec2:RunInstances",
                "ec2:DescribeSubnets",
                "ec2:DescribeSecurityGroups",
                "ec2:DescribeLaunchTemplates",
                "ec2:DescribeInstances",
                "ec2:DescribeInstanceTypes",
                "ec2:DescribeInstanceTypeOfferings",
                "ec2:DescribeAvailabilityZones",
                "ec2:DeleteLaunchTemplate",
                "ec2:CreateTags",
                "ec2:CreateLaunchTemplate",
                "ec2:CreateFleet",
                "ec2:DescribeSpotPriceHistory",
                "pricing:GetProducts"
            ],
            "Effect": "Allow",
            "Resource": "*",
            "Sid": "Karpenter"
        },
        {
            "Action": "ec2:TerminateInstances",
            "Condition": {
                "StringLike": {
                    "ec2:ResourceTag/karpenter.sh/provisioner-name": "*"
                }
            },
            "Effect": "Allow",
            "Resource": "*",
            "Sid": "ConditionalEC2Termination"
        },
        {
            "Effect": "Allow",
            "Action": "iam:PassRole",
            "Resource": "arn:${AWS_PARTITION}:iam::${AWS_ACCOUNT_ID}:role/KarpenterNodeRole-${CLUSTER_NAME}",
            "Sid": "PassNodeIAMRole"
        },
        {
            "Effect": "Allow",
            "Action": "eks:DescribeCluster",
            "Resource": "arn:${AWS_PARTITION}:eks:${AWS_REGION}:${AWS_ACCOUNT_ID}:cluster/${CLUSTER_NAME}",
            "Sid": "EKSClusterEndpointLookup"
        }
    ],
    "Version": "2012-10-17"
}
EOF

aws iam put-role-policy --role-name KarpenterControllerRole-${CLUSTER_NAME} \
    --policy-name KarpenterControllerPolicy-${CLUSTER_NAME} \
    --policy-document file://controller-policy.json
환경 설정과 적절한 권한이 주어져 있다면 이과정에서 에러는 나지 않는다.
IAM까지 했다면 거의 다한거다.
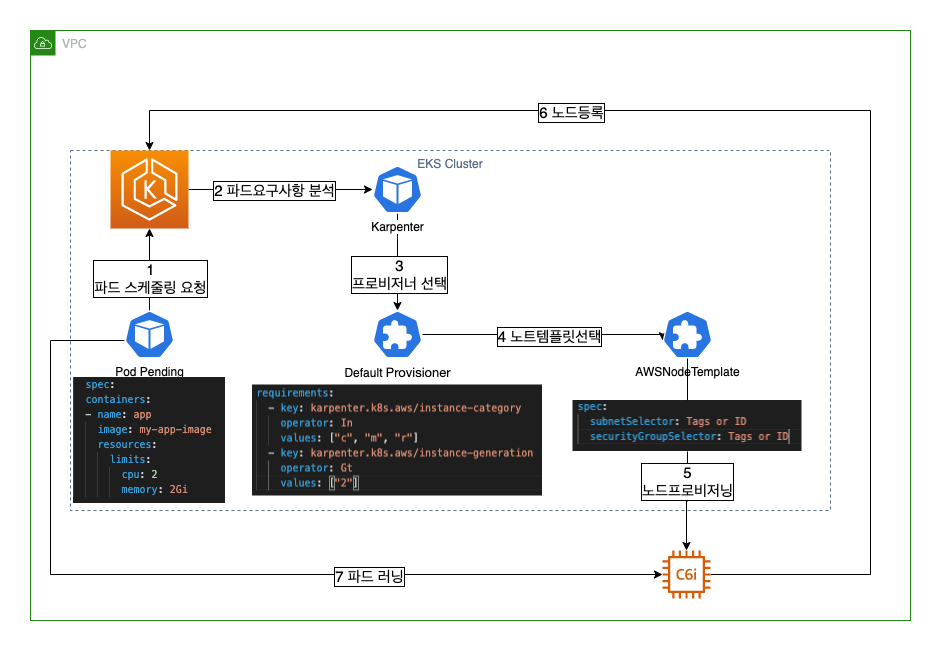
IAM에는 KarpenterNodeRole 을 만들고 권한부여하고 KarpenterNodeInstanceProfile 을 Role에 추가한다. 이름과도 같이 프로비저닝된 Karpenter Node가 가지게 될 Role 이다.
또 KarpenterControllerRole 은 IRSA로 Karpenter Pod에 부여될 Role이다. 그다음에 필수로 있어야하는건 서브넷과 보안그룹이다. 인스턴스가 프로비저닝 되기위한 필수 조건이 바로 이것이다.
이 실습에선 Karpenter의 기본설정을 따라가지만 이해를 돕기위해 직접 태깅을 추가한다. 만일 NodeGroup를 사용하고 있고 전환하길 원한다면 가이드에 나온 스크립트를 사용해도 좋다.
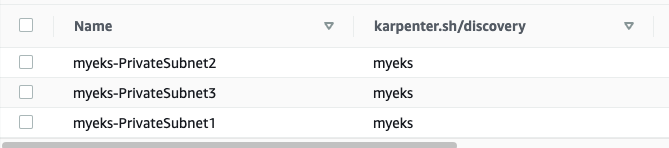
나는 이렇게 추가했다 karpenter.sh/discovery = myeks 다
그다음엔 보안그룹에 태그를 추가해준다
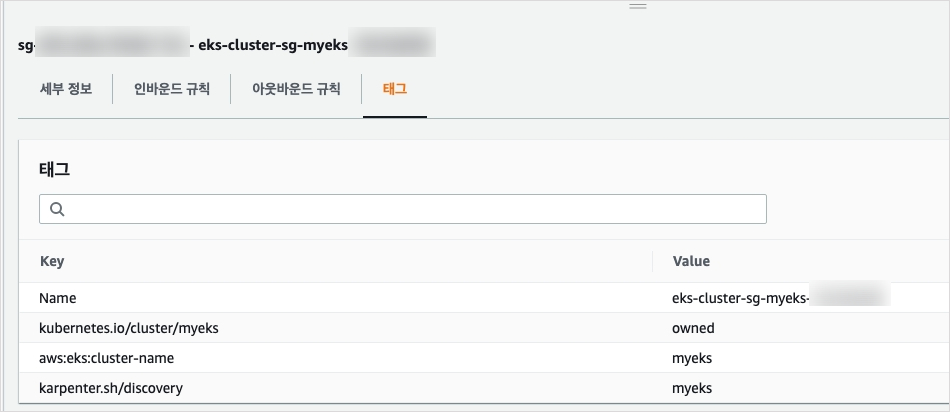
서브넷과 동일하게 했다. 실제로 사용할때에 AWSNodeTemplate 을 작성할때 사용할 태그이다.
이렇게 진행했다면 이제 Karpenter 에서 프로비저닝한 노드가 클러스터에 Join이 가능하도록 허용해줘야 한다.
kubectl edit configmap aws-auth -n kube-system
apiVersion: v1
data:
  mapRoles: |
  - groups:
    - system:bootstrappers
    - system:nodes
    rolearn: arn:aws:iam::${AWS_ACCOUNT_ID}:role/KarpenterNodeRole-${CLUSTER_NAME}
    username: system:node:{{EC2PrivateDNSName}}
mapRoles 아래에 넣는다. 변수부분 수정해서 넣어야한다.
이제 드디어 카펜터를 설치한다. 이과정에는 헬름이 필수다.
 helm template karpenter oci://public.ecr.aws/karpenter/karpenter \
  --version ${KARPENTER_VERSION} \
 --namespace karpenter   \
 --set clusterName=${CLUSTER_NAME}   \
 --set settings.aws.clusterName=${CLUSTER_NAME}     \
 --set clusterEndpoint=${CLUSTER_ENDPOINT}     \
 --set settings.aws.defaultInstanceProfile=KarpenterNodeInstanceProfile-${CLUSTER_NAME}     \
 --set serviceAccount.annotations."eks\.amazonaws\.com/role-arn"="arn:${AWS_PARTITION}:iam::${AWS_ACCOUNT_ID}:role/KarpenterControllerRole-${CLUSTER_NAME}"     \
 --set controller.resources.requests.cpu=1     \
 --set controller.resources.requests.memory=1Gi     \
 --set controller.resources.limits.cpu=1     \
 --set controller.resources.limits.memory=1Gi > karpenter.yaml
settings.aws.clusterName / clusterName 이두가지 옵션은 다른옵션이다. 헷갈리지 말자.
우리는 NodeLess 를 진행중이기 때문에 여기서 Karpneter 가이드와 다르게 간다.
aws eks create-fargate-profile --fargate-profile-name karpenter --cluster-name myeks --pod-execution-role-arn arn:aws:iam::${AWS_ACCOUNT_ID}:role/AmazonEKSFargatePodExecutionRole --subnets "subnet-1" "subnet-2" "subnet-3"이렇게 karpenter Fargate Profile을 생성하였다면 이제 Karpenter의 컴포넌트와 CRD를 같이 배포해줄 때다.
kubectl create namespace karpenter
kubectl create -f \
  https://raw.githubusercontent.com/aws/karpenter/${KARPENTER_VERSION}/pkg/apis/crds/karpenter.sh_provisioners.yaml
kubectl create -f \
    https://raw.githubusercontent.com/aws/karpenter/${KARPENTER_VERSION}/pkg/apis/crds/karpenter.k8s.aws_awsnodetemplates.yaml
kubectl apply -f karpenter.yaml
이렇게 배포하면 파게이트에 배포된 Karpenter 를 만날수 있다.
k get pod -o wide
NAME                         READY   STATUS    RESTARTS   AGE   IP               NODE                                                        NOMINATED NODE   READINESS GATES
karpenter-5bffc6f5d8-p2pxh   1/1     Running   0          9d    192.168.12.183   fargate-ip-192-168-12-183.ap-northeast-2.compute.internal   <none>           <none>
karpenter-5bffc6f5d8-qgcwn   1/1     Running   0          9d    192.168.13.157   fargate-ip-192-168-13-157.ap-northeast-2.compute.internal   <none>           <none>
Karpenter는 버전에 따라 Pod내에 Container 가 2개인 경우가 있다. 이경우엔 컨트롤러와 웹훅용도의 컨테이너가 두개가 동작한다. 일정버전 이상에서만 Fargate에 프로비저닝 된다. 그냥 v0.27.3버전 이상쓰자.
하다가 안되면 대부분 유저 문제다.
https://karpenter.sh/v0.27.3/troubleshooting/
을보자.
설치가 드디어 완료됬다. 다음은 Karpenter 의 두가지 CRD에 대한 설명을 할것이다.