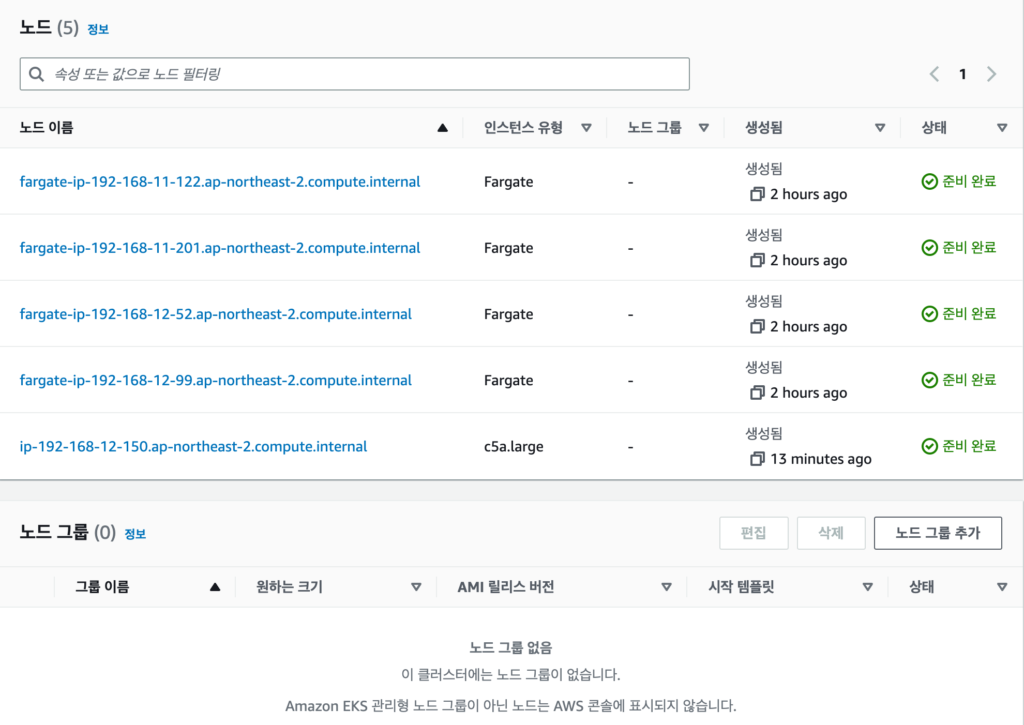
이런식으로 만들고 파게이트는 네임스페이스로 지정하면 네임스페이스에 만들어지는 톨레이션이나 다른 노드 어피니티등을 가지지 않은 Pod를 Fargate로 프로비저닝 한다. 이때 일반적인 쿠버네티스와 다른 부분은 Fargate 스케줄러(fargate-scheduler)가 별도로 동작하여 Fargate를 프로비저닝한다. 일반적인 경우엔 (default-scheduler)가 Pod를 프로비저닝 한다.
EKS의 관리영역중 Addon 이나 필수 컴포넌트중에 Node에서 동작해야하는 것들이 있다. 이 경우에 NodeGroup을 운영해야한다. NodeGroup에 여러 파드들이 스케줄링되고 관리형 Pod들은 다른 서비스에 운영되는 NodeGroup과 섞여서 스케줄리되어야 하는데, 이것의 가장큰 문제는 Node의 사망이 기능의 장애로 이어진다는 점이다. 따라서 Node를 전용 Node로 사용하면 좋은데 아주작은 노드를 스케줄링한다고 해도 관리되어야 하는 대상이 됨은 틀림없고, 노드를 정해서 사용해야 하는 문제점들이 생기게된다.
이러한 문제를 해결하기에 EKS에서는 Fargate가 있다. 1Node - 1Pod 라는게 아주 중요한 포인트다.
 k get pod -o wide
NAME                      READY   STATUS    RESTARTS   AGE     IP              NODE                                                       NOMINATED NODE   READINESS GATES
coredns-fd69467b9-bsh88   1/1     Running   0          5h18m   192.168.13.23   fargate-ip-192-168-13-23.ap-northeast-2.compute.internal   <none>           <none>
coredns-fd69467b9-gn24k   1/1     Running   0          5h18m   192.168.12.34   fargate-ip-192-168-12-34.ap-northeast-2.compute.internal   <none>           <none>
# k events
5s                      Normal    NodeAllocatableEnforced   Node/i-0a7504d19e11fb642   Updated Node Allocatable limit across pods
4s                       Normal    Scheduled                 Pod/unsafe                 Successfully assigned default/unsafe to i-0a7504d19e11fb642
3s                       Normal    Pulling                   Pod/unsafe                 Pulling image "centos:7"
k get pod
NAME     READY   STATUS    RESTARTS   AGE
unsafe   1/1     Running   0          20s
정상적으로 스케줄링된것이 보인다.
이로서 unsafe 파라미터를 영구적으로 적용할수 있게되었다.
이렇게 파라미터를 적용하고 나서, net.core.somaxconn 을 테스트하였다. 정상적으로 적용된것이 보인다. 사실 단순히 somaxconn만 적용한다고 뭔가 달라지지 않는다. syn_backlog 값도 같이 늘려야 한다. 그리고 적용된 값은 Listen() 시스템 콜을 할때 적용 되기 때문에 이 파라미터 들은 컨테이너가 시작될때 적용된다고 보면 된다.
이런 과정을 거쳐서 테스트를 진행했으나, 실은 트래픽을 20% 더 받았을 뿐 증상이 완화 되지 않았다.
결국 해결은 kubenetes 안에 있지 않았고 Linux 안에 있었다. irqbalance의 smp_affinity 가 정상적으로 인터럽트 해주지 않아서 cpu0만 열심히 일하고 있었던 것이다.
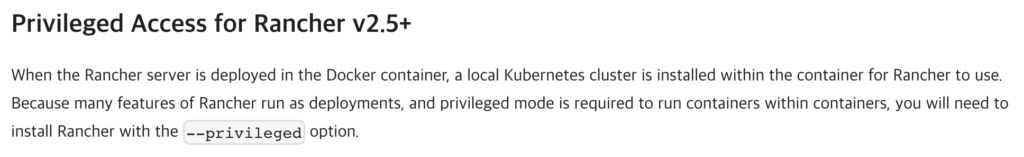
이런과정에서 privileged / unsafe 에 대해서 알게되었다.
5주차 과정을 진행하면서 다시금 그때의 기억과 내용을 자세히 알게되면서 새로운 부분도 알되게었고, 새로이 정리도 하게되었다.
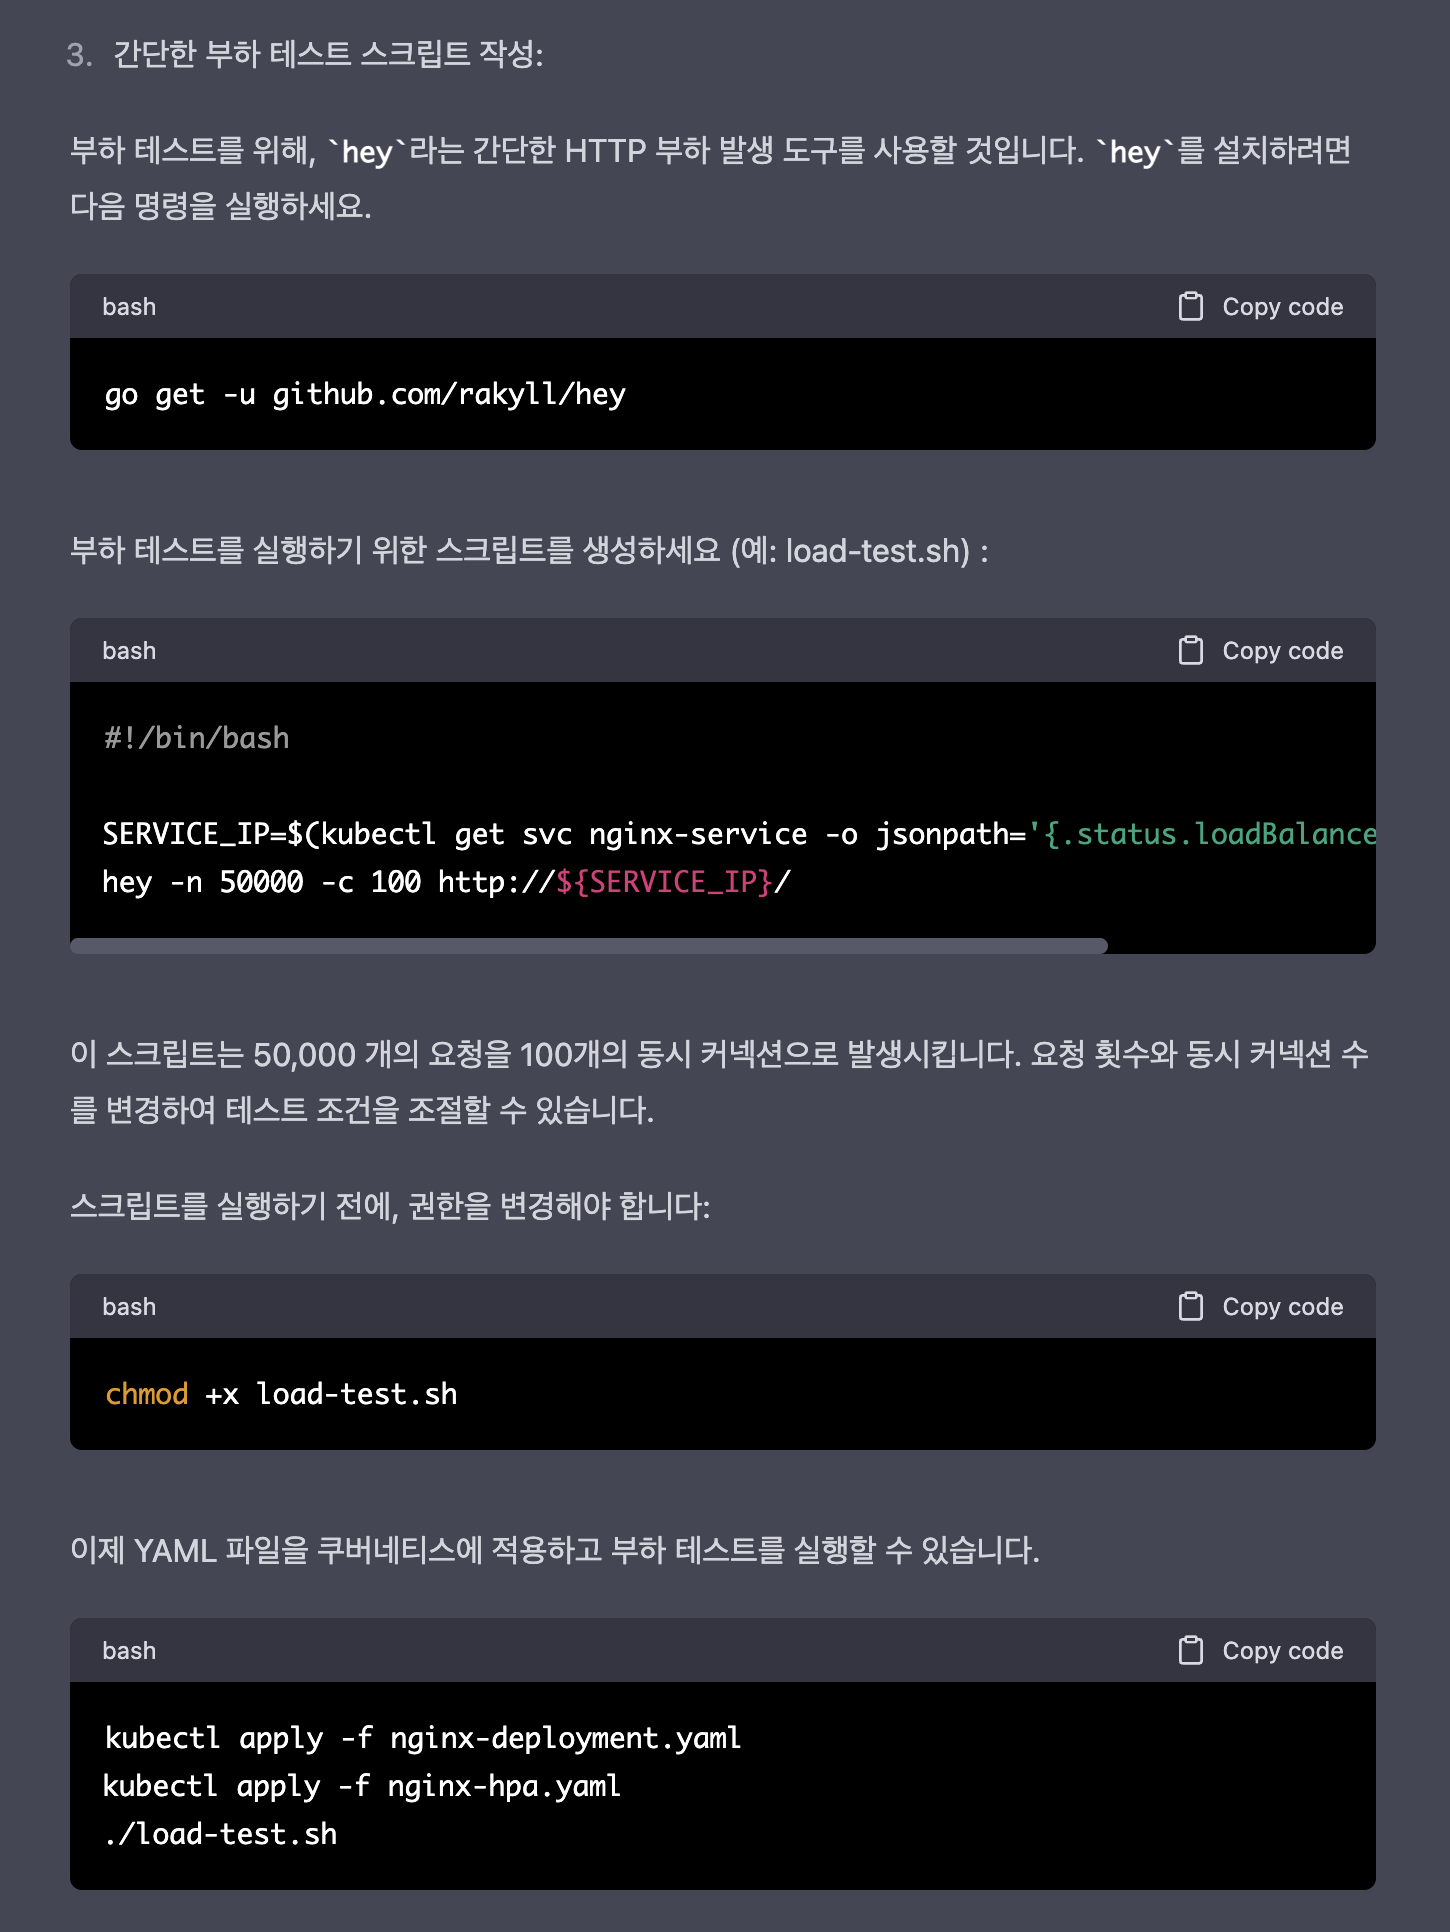
#!/bin/bash

SERVICE_IP=$(kubectl get svc nginx-service -o jsonpath='{.status.loadBalancer.ingress[0].ip}')
CONCURRENCY=100
REQUESTS=50000

# Run load test
for i in $(seq 1 $CONCURRENCY); do
  (for j in $(seq 1 $(($REQUESTS / $CONCURRENCY))); do
    curl -s -o /dev/null http://${SERVICE_IP}/
  done) &
done

# Wait for all background processes to complete
wait
위의 Manifast 를 적용한 결과는 다음과 같다.
 k get all
NAME                                    READY   STATUS    RESTARTS   AGE
pod/nginx-deployment-7c6895c677-cblrh   1/1     Running   0          15s
pod/nginx-deployment-7c6895c677-s6b5c   1/1     Running   0          15s
pod/nginx-deployment-7c6895c677-smkxv   1/1     Running   0          15s

NAME                    TYPE           CLUSTER-IP      EXTERNAL-IP   PORT(S)        AGE
service/nginx-service   LoadBalancer   100.66.65.216   <pending>     80:30979/TCP   15s

NAME                               READY   UP-TO-DATE   AVAILABLE   AGE
deployment.apps/nginx-deployment   3/3     3            3           15s

NAME                                          DESIRED   CURRENT   READY   AGE
replicaset.apps/nginx-deployment-7c6895c677   3         3         3       15s

NAME                                            REFERENCE                     TARGETS         MINPODS   MAXPODS   REPLICAS   AGE
horizontalpodautoscaler.autoscaling/nginx-hpa   Deployment/nginx-deployment   <unknown>/50%   3         10        3          19s
k get ingress
NAME         CLASS    HOSTS   ADDRESS                                                                     PORTS   AGE
my-ingress   <none>   *       k8s-nginx-myingres-106681c1f1-1873214288.ap-northeast-2.elb.amazonaws.com   80      72s
ingress - svc - deployment - hpa 구조 같은건 이제 3분이면 나온다.
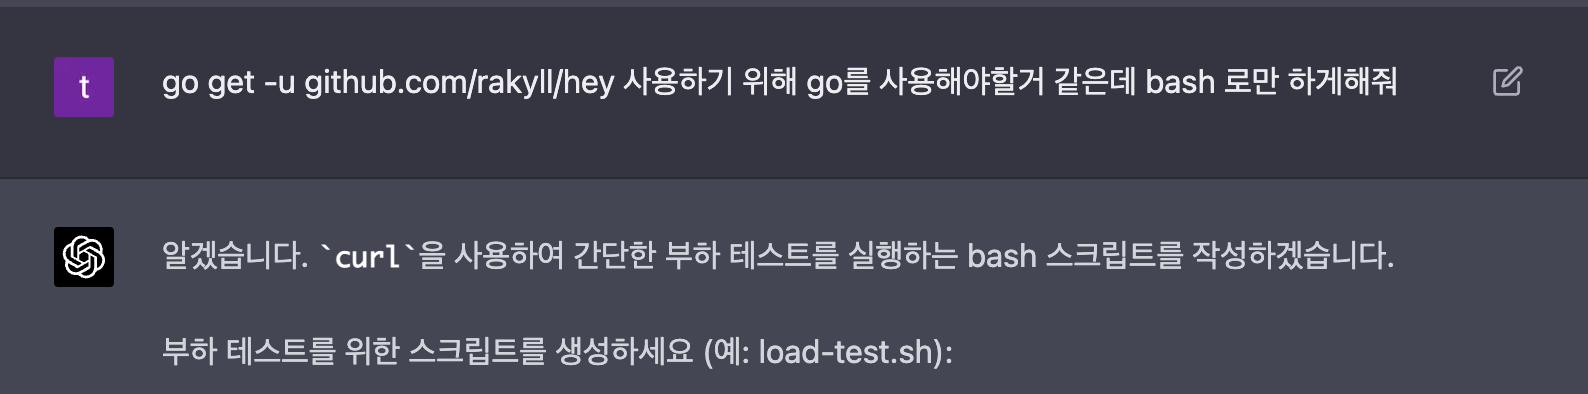
gpt가 알려준 스크립트중
kubectl get svc nginx-service -o jsonpath='{.status.loadBalancer.ingress[0].ip}'
부분을
kubectl get ingress my-ingress -o jsonpath='{.status.loadBalancer.ingress[0].hostname}'
다음과 같이 수정하였다.
curl k8s-nginx-myingres-106681c1f1-1873214288.ap-northeast-2.elb.amazonaws.com
<!DOCTYPE html>
<html>
<head>
<title>Welcome to nginx!</title>
<style>
html { color-scheme: light dark; }
body { width: 35em; margin: 0 auto;
font-family: Tahoma, Verdana, Arial, sans-serif; }
</style>
</head>
<body>
<h1>Welcome to nginx!</h1>
<p>If you see this page, the nginx web server is successfully installed and
working. Further configuration is required.</p>

<p>For online documentation and support please refer to
<a href="http://nginx.org/">nginx.org</a>.<br/>
Commercial support is available at
<a href="http://nginx.com/">nginx.com</a>.</p>

<p><em>Thank you for using nginx.</em></p>
</body>
</html>
잘 뜬다.
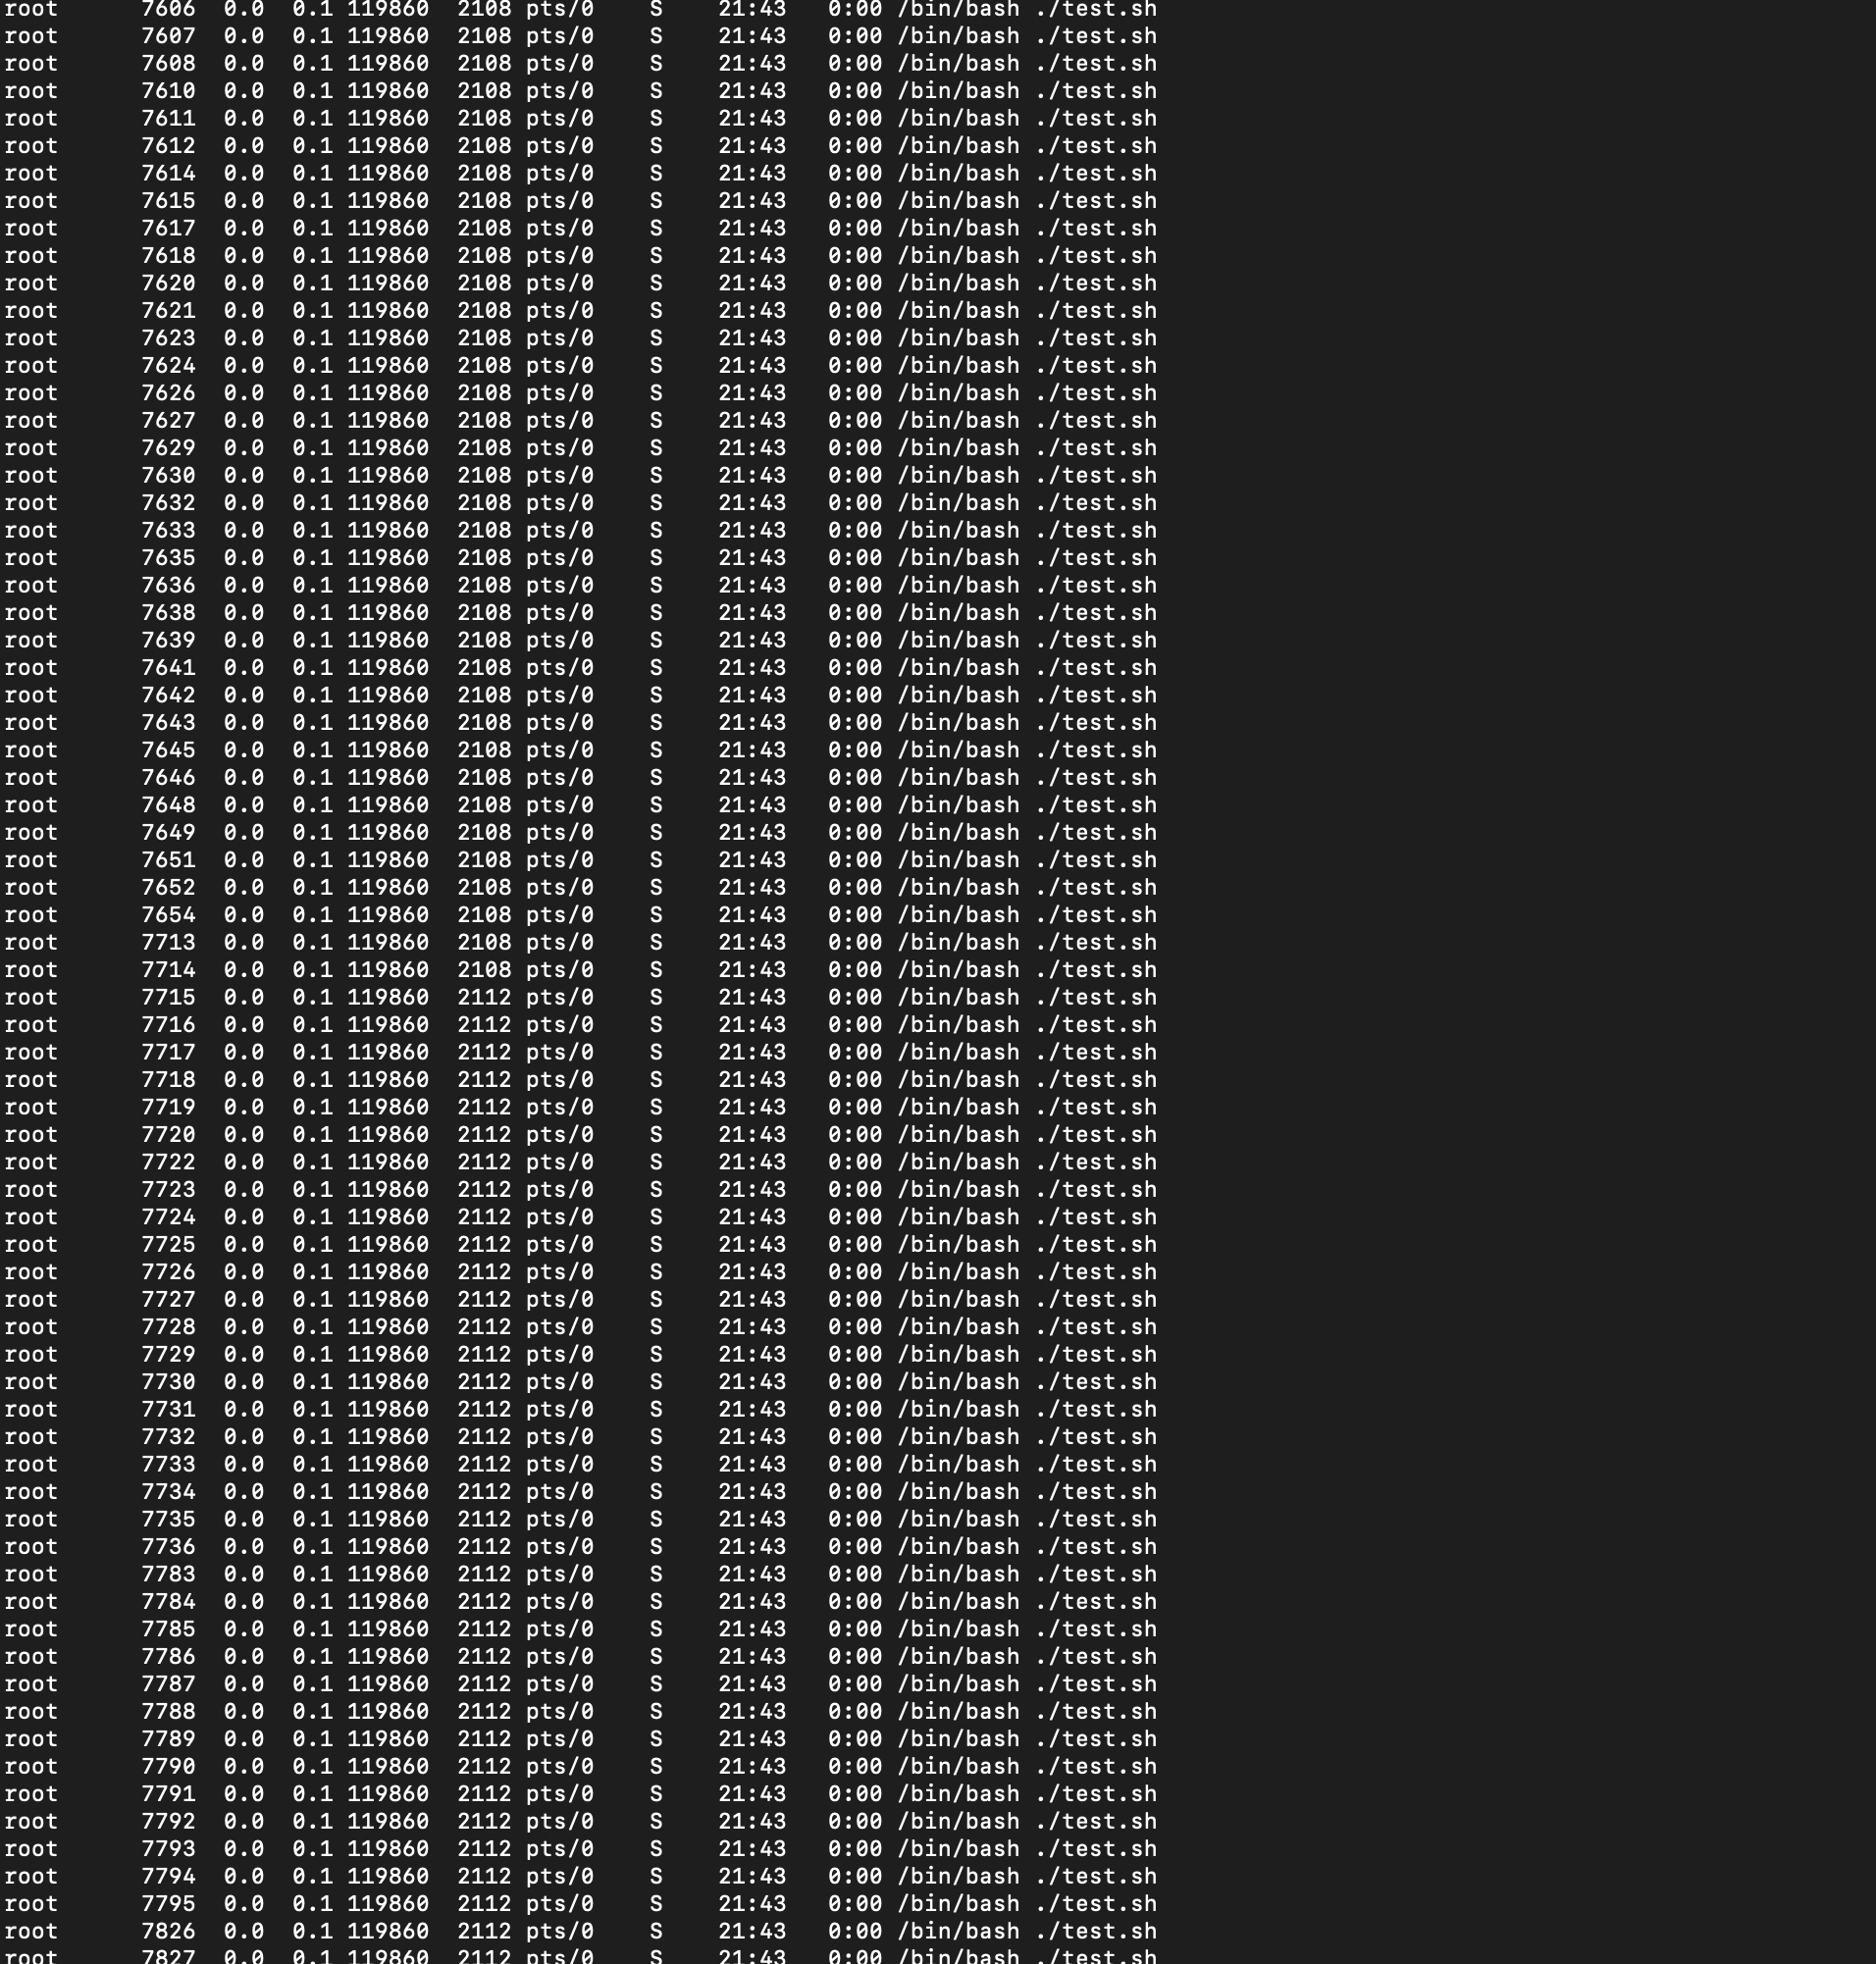
이제 공격 간다
굉장한 스크립트 였다... 한방에 100개의 스크립트가 떴다...후....
근데 nginx 는 너무 가벼운 친구라...ㅠㅠ hpa 가 잘작동하지 않았다. 리미트를 준다.
        resources:
          limits:
            cpu: 15m
            memory: 10Mi
          requests:
            cpu: 15m
            memory: 10Mi

k get hpa
NAME        REFERENCE                     TARGETS   MINPODS   MAXPODS   REPLICAS   AGE
nginx-hpa   Deployment/nginx-deployment   33%/50%   3         10        3          25m
좋다 적절하다.
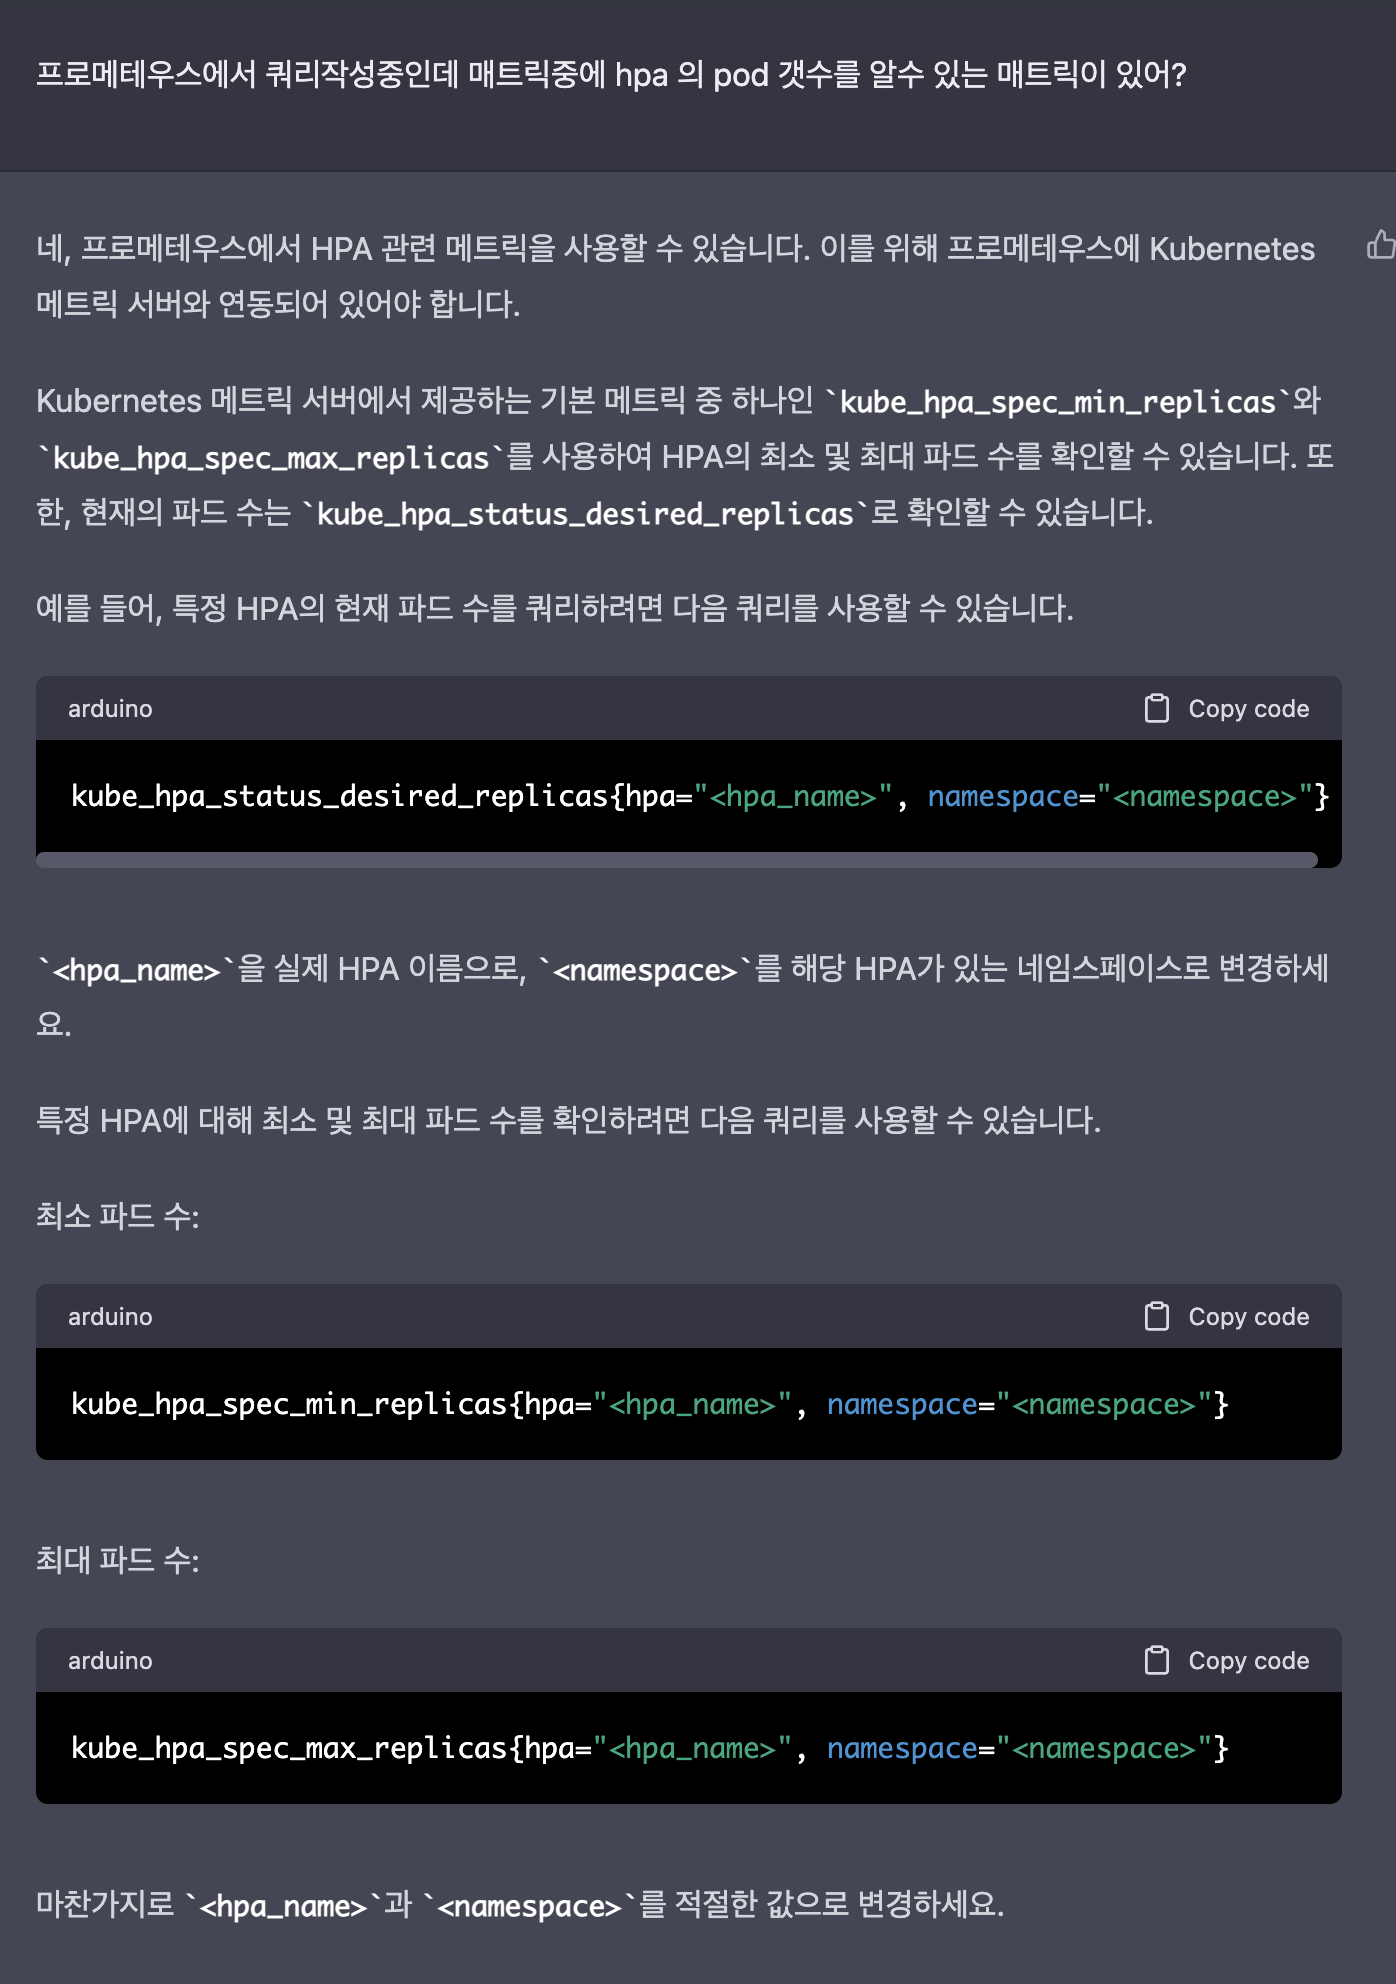
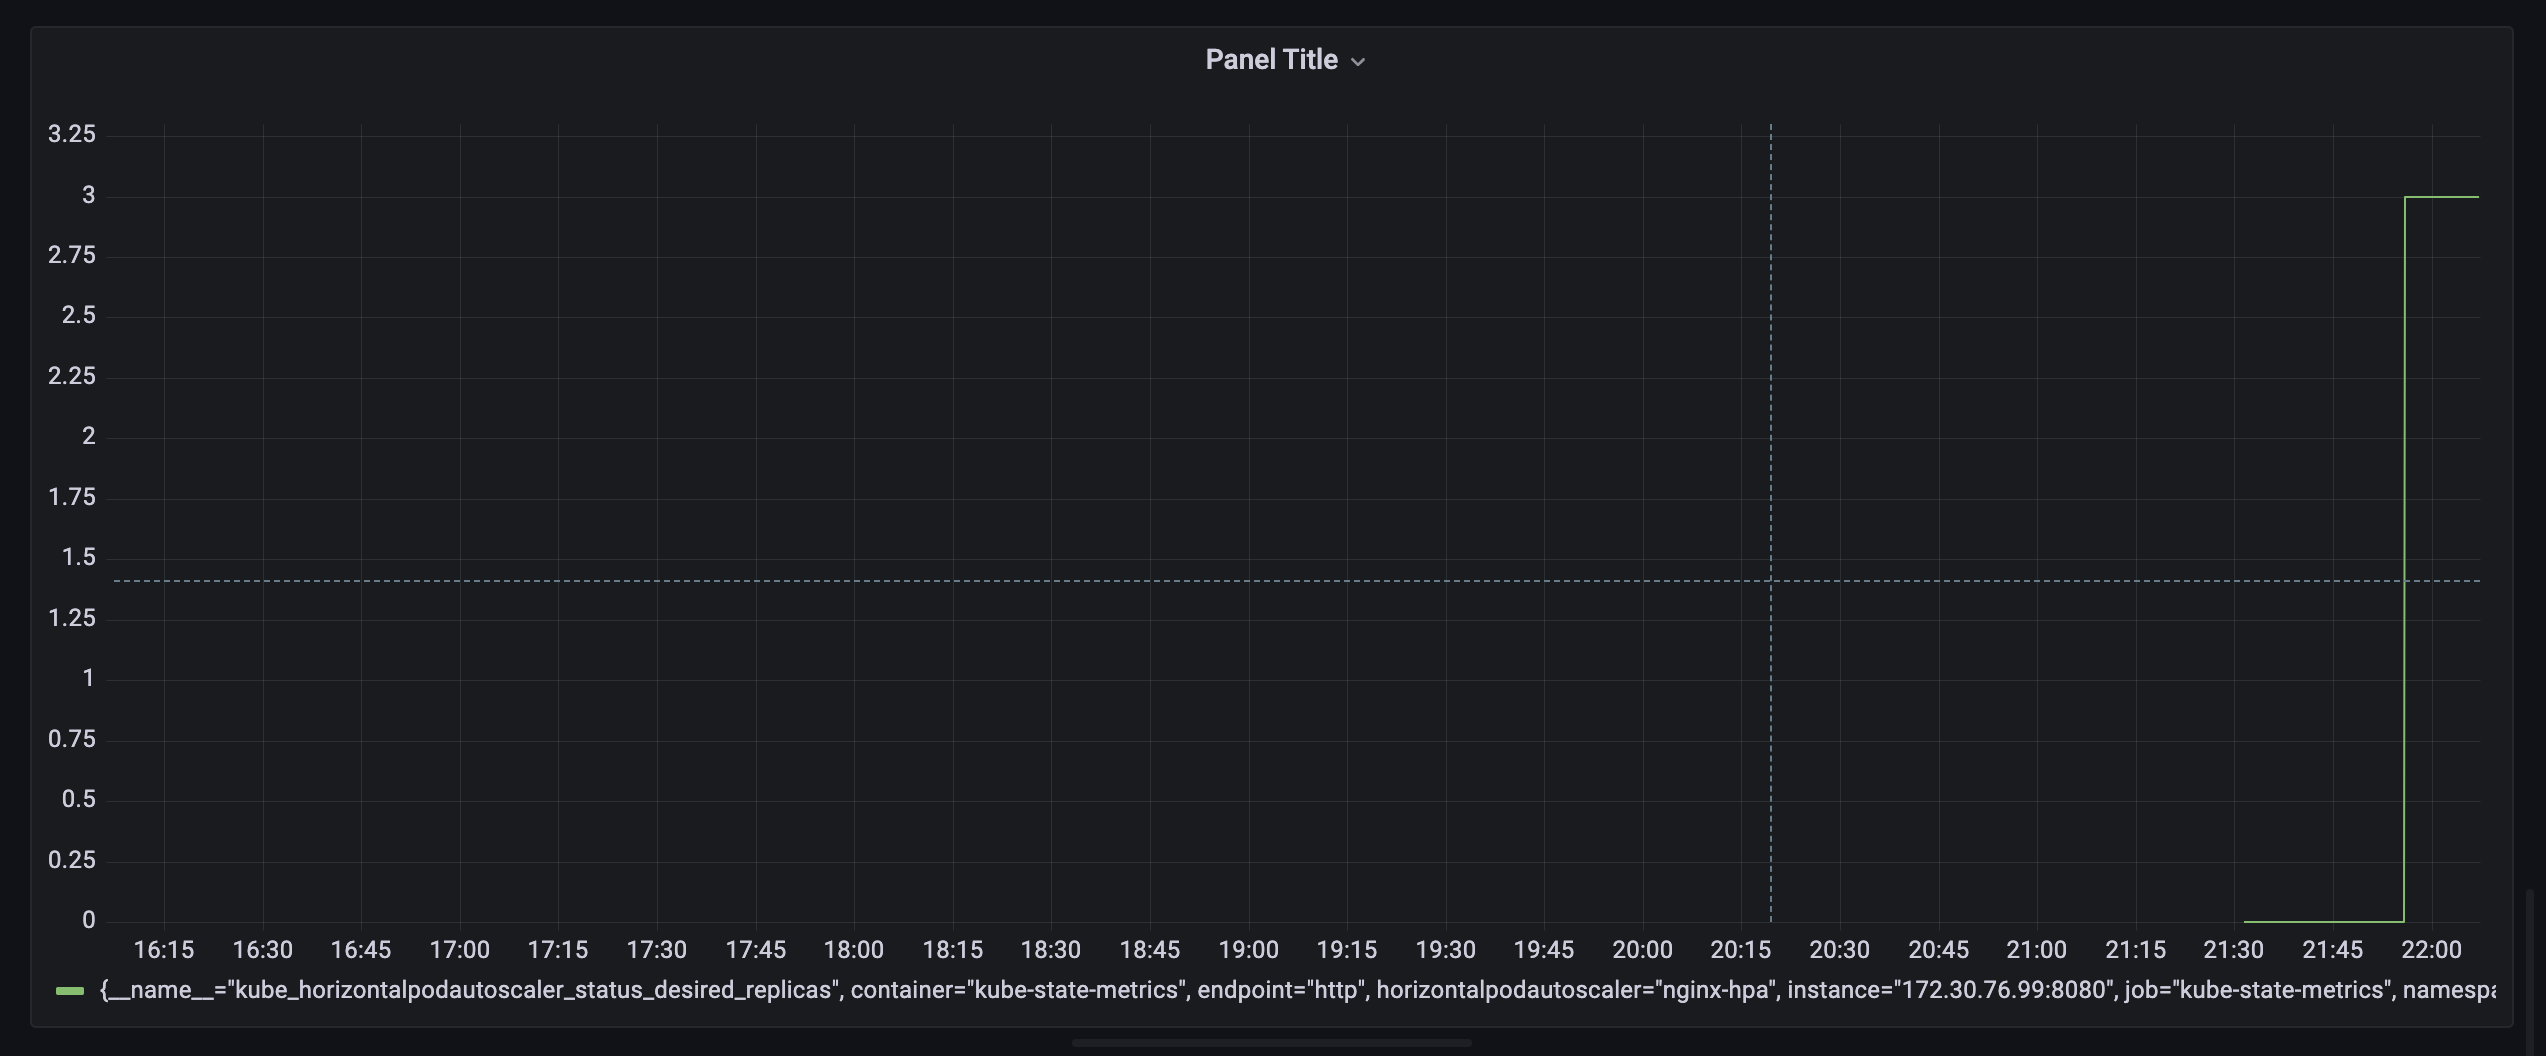
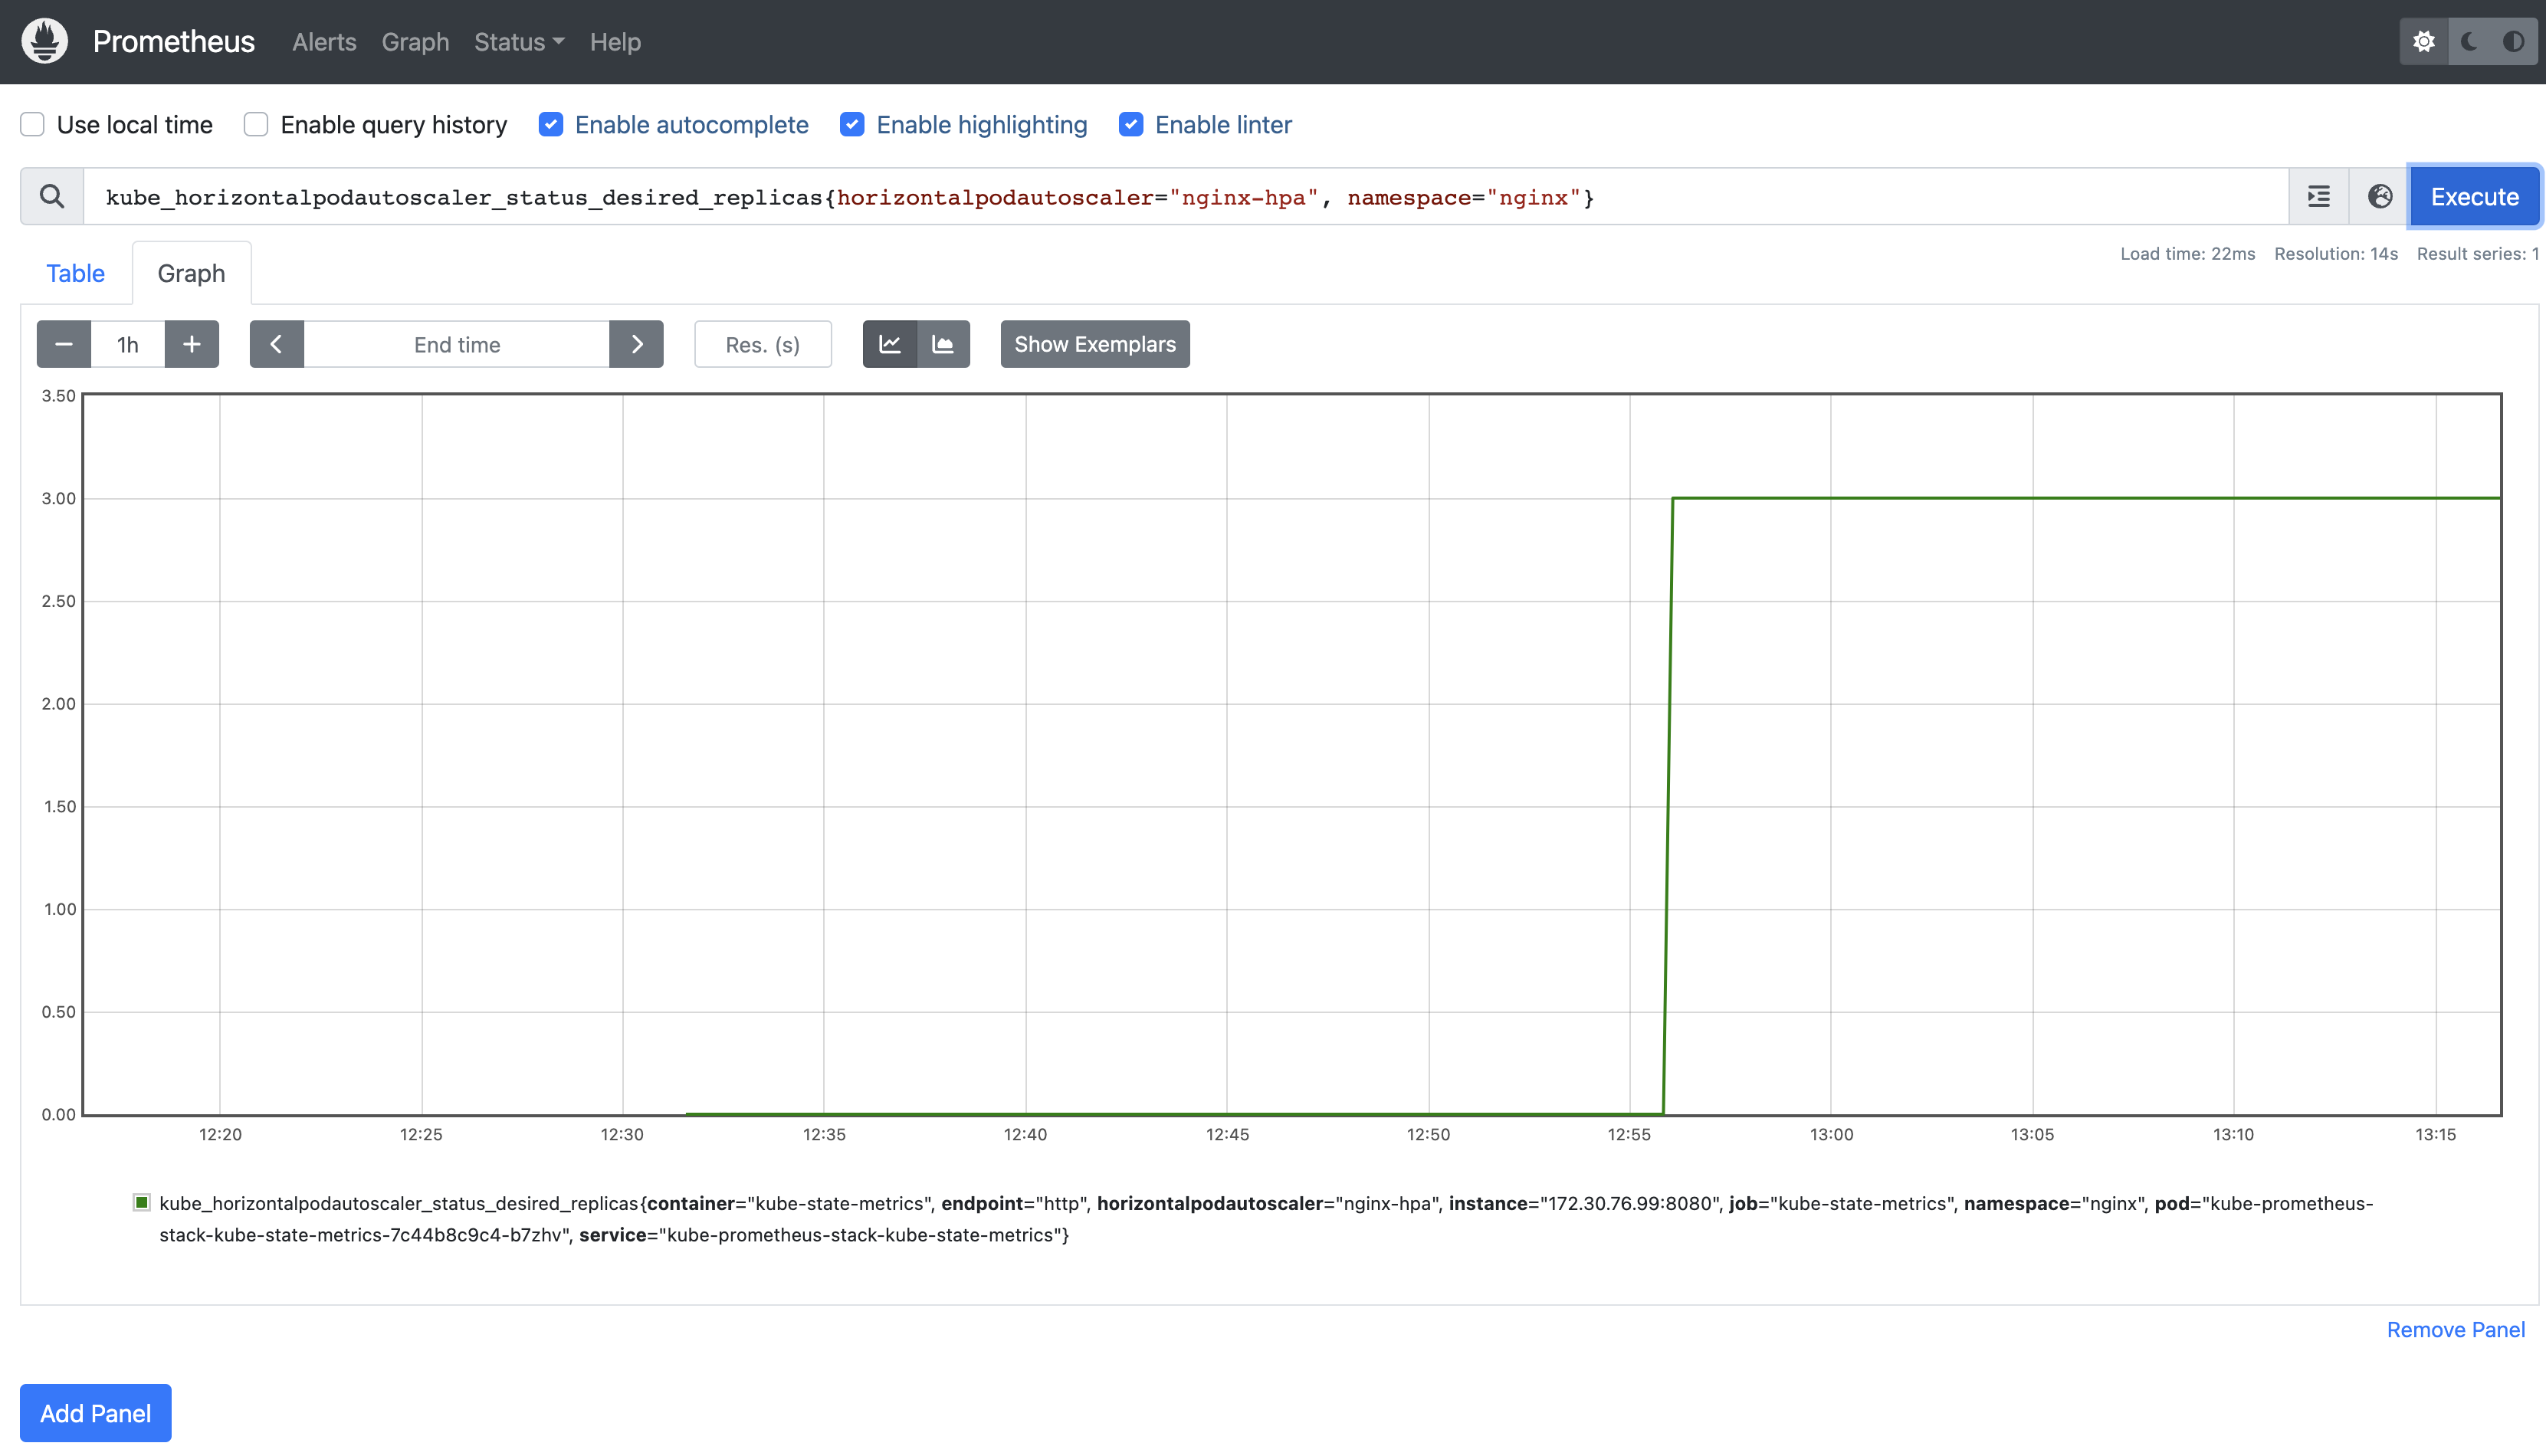
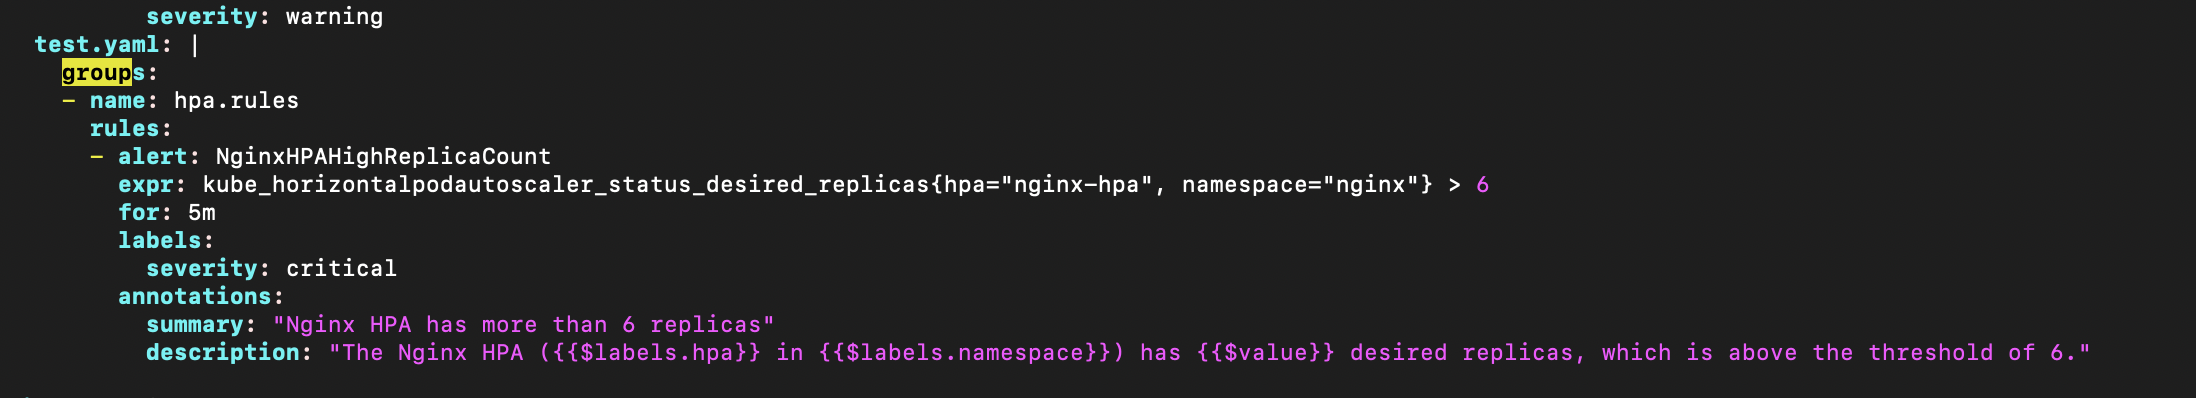
이제 셋업은 다되었다. hpa 가 동작하는 대시보드와 hap 가 일정이상 동작해서 max 에 가 까워지면 알럿을 날릴거다.
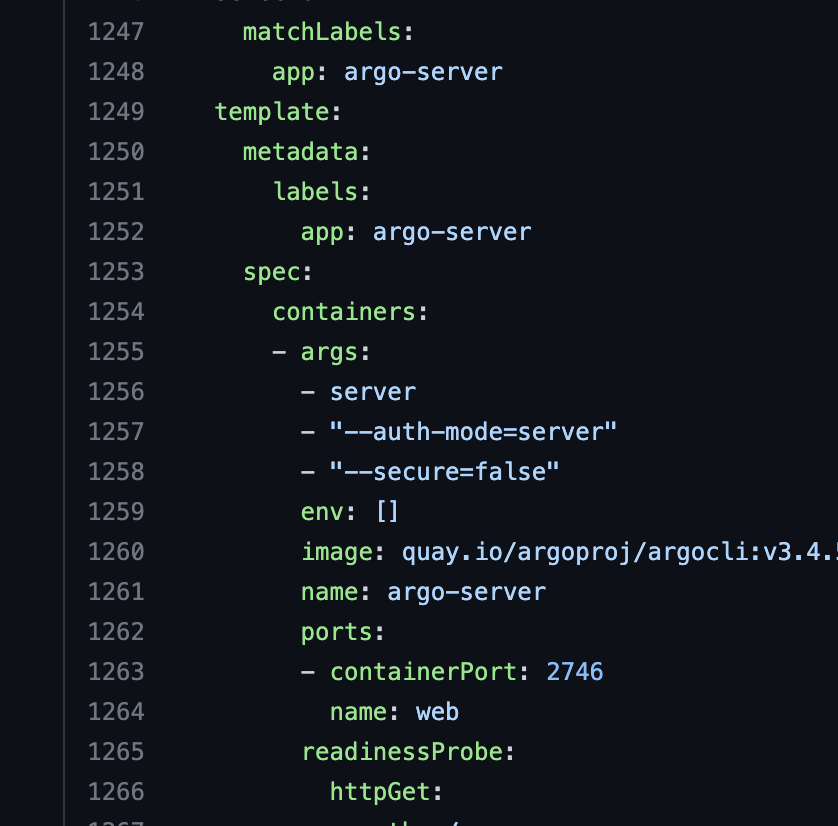
1257 / 1258 라인을 을 추가해야한다. 그래야 백엔드가 HTTP로 동작하고 인증모드가 서버로 동작한다 혹시 쓰고싶다면 sso 를 붙여야한다.
k create ns argo
k apply -f Argo-WorkFlow-install.yaml
customresourcedefinition.apiextensions.k8s.io/clusterworkflowtemplates.argoproj.io created
customresourcedefinition.apiextensions.k8s.io/cronworkflows.argoproj.io created
customresourcedefinition.apiextensions.k8s.io/workflowartifactgctasks.argoproj.io created
customresourcedefinition.apiextensions.k8s.io/workfloweventbindings.argoproj.io created
customresourcedefinition.apiextensions.k8s.io/workflows.argoproj.io created
customresourcedefinition.apiextensions.k8s.io/workflowtaskresults.argoproj.io created
customresourcedefinition.apiextensions.k8s.io/workflowtasksets.argoproj.io created
customresourcedefinition.apiextensions.k8s.io/workflowtemplates.argoproj.io created
serviceaccount/argo created
serviceaccount/argo-server created
role.rbac.authorization.k8s.io/argo-role created
clusterrole.rbac.authorization.k8s.io/argo-aggregate-to-admin created
clusterrole.rbac.authorization.k8s.io/argo-aggregate-to-edit created
clusterrole.rbac.authorization.k8s.io/argo-aggregate-to-view created
clusterrole.rbac.authorization.k8s.io/argo-cluster-role created
clusterrole.rbac.authorization.k8s.io/argo-server-cluster-role created
rolebinding.rbac.authorization.k8s.io/argo-binding created
clusterrolebinding.rbac.authorization.k8s.io/argo-binding created
clusterrolebinding.rbac.authorization.k8s.io/argo-server-binding created
configmap/workflow-controller-configmap created
service/argo-server created
priorityclass.scheduling.k8s.io/workflow-controller created
deployment.apps/argo-server created
deployment.apps/workflow-controller created
CRD부터 SA role 등등 마지막으로 2개의 deployment를 만든다. 그럼 내가 추가한 설정이 잘추가 됬는 지 확인하고 싶다면 argo-server 의 시작 로그를 확인한다.
k logs argo-server-5779fd7868-nb77l
time="2023-03-21T12:56:22.411Z" level=info msg="not enabling pprof debug endpoints"
time="2023-03-21T12:56:22.411Z" level=info authModes="[server]" baseHRef=/ managedNamespace= namespace=argo secure=false ssoNamespace=argo
time="2023-03-21T12:56:22.412Z" level=warning msg="You are running in insecure mode. Learn how to enable transport layer security: https://argoproj.github.io/argo-workflows/tls/"
time="2023-03-21T12:56:22.412Z" level=warning msg="You are running without client authentication. Learn how to enable client authentication: https://argoproj.github.io/argo-workflows/argo-server-auth-mode/"
time="2023-03-21T12:56:22.412Z" level=info msg="SSO disabled"
time="2023-03-21T12:56:22.422Z" level=info msg="Starting Argo Server" instanceID= version=v3.4.5
time="2023-03-21T12:56:22.422Z" level=info msg="Creating event controller" asyncDispatch=false operationQueueSize=16 workerCount=4
time="2023-03-21T12:56:22.425Z" level=info msg="GRPC Server Max Message Size, MaxGRPCMessageSize, is set" GRPC_MESSAGE_SIZE=104857600
time="2023-03-21T12:56:22.425Z" level=info msg="Argo Server started successfully on http://localhost:2746" url="http://localhost:2746"
automode 에 [server] 이 들어가있다면 정상적으로 먹은거다. 기본이 Clinet다. 그리고 서버 시작로그에 url 에 https 가 아니라 http 면 백엔드가 http 인거다.
여기까지 하면 이제 WorkFlow를 사용할 준비가 아직 안된거다. 이건 단순히 컨트롤러와 argo-server UI까지만 설치한거다.
원래 Argo-WorkFlow 와 Argo-Events 는 namespace로 분리되어있지만 나는 이 CRD의 지저분함을 견딜수없어서 argo namespace 하나로 구성했다 Argo-Events-install.yaml 파일은 namespace를 수정한 파일이다.
 k apply -f Argo-Events-install.yaml
customresourcedefinition.apiextensions.k8s.io/eventbus.argoproj.io created
customresourcedefinition.apiextensions.k8s.io/eventsources.argoproj.io created
customresourcedefinition.apiextensions.k8s.io/sensors.argoproj.io created
serviceaccount/argo-events-sa created
clusterrole.rbac.authorization.k8s.io/argo-events-aggregate-to-admin created
clusterrole.rbac.authorization.k8s.io/argo-events-aggregate-to-edit created
clusterrole.rbac.authorization.k8s.io/argo-events-aggregate-to-view created
clusterrole.rbac.authorization.k8s.io/argo-events-role created
clusterrolebinding.rbac.authorization.k8s.io/argo-events-binding created
configmap/argo-events-controller-config created
deployment.apps/controller-manager created
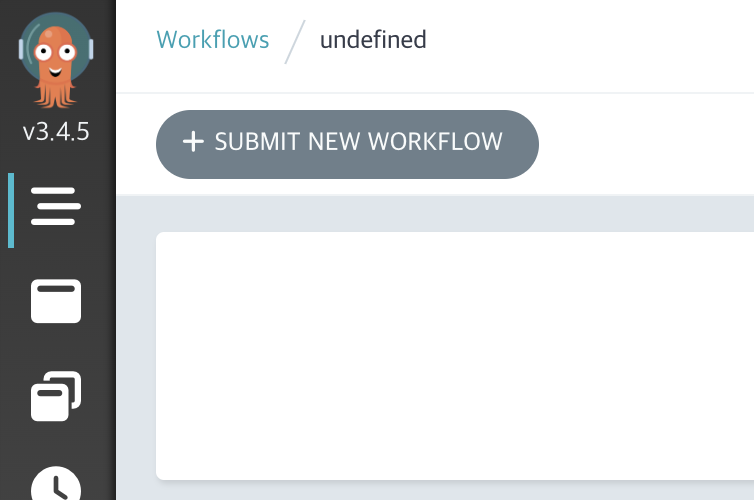
그러면 꼴뚜기 친구를 볼수있다. 이제 WorkFlow UI 까지 띄우고 Events 를 사용할 준비가 마무리 된거다.
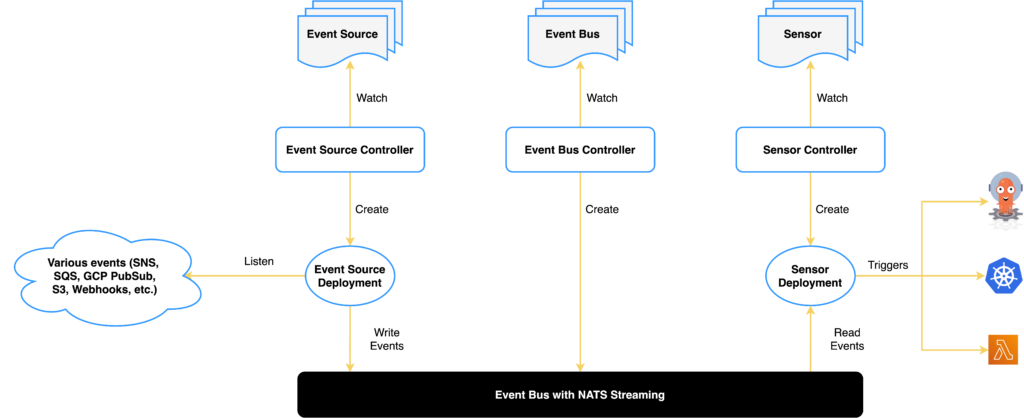
git webhook을 이용한 간단한 테스트 정도만 이어 갈거다 걱정하지 마라. 먼저 알아야 할것은 workflow / Events 라는 놈은 CRD를 떡칠해 놨기에 우리가 생각하는 K8S의 컴포넌트 동작과는 다르다. K8S의 컴포넌트를 이용하긴 하나, 받아서 던져주는 EventBus 같은녀석도 있기때문에 Ingress 가 정상적으로 동작해도 Bus를 탈수없는 경우도 있다.
그럼 Events 로 가기전에 CRD의 RBAC를 설치해야 한다.
 # sensor rbac
k apply -f https://raw.githubusercontent.com/argoproj/argo-events/master/examples/rbac/sensor-rbac.yaml
 # workflow rbac
k apply -f https://raw.githubusercontent.com/argoproj/argo-events/master/examples/rbac/workflow-rbac.yaml
나는 이 RBAC를 적용하면서 사실 살짝 현타가 왔다. CRD의 모든 동작을 알순없더라도 적어도 내가 통제할수는 있는 레벨이어야 하는데 너무 쪼개진 컴포넌트 들이 나를 힘들게 했다.
EventSource 의 yaml 은 하나지만 CRD라 Service 와 Pod를 배포해준다.
 k get all -l eventsource-name=webhook
NAME                                             READY   STATUS    RESTARTS   AGE
pod/webhook-eventsource-r7x58-8575c749bb-fsjnf   1/1     Running   0          6m

NAME                              TYPE        CLUSTER-IP       EXTERNAL-IP   PORT(S)     AGE
service/webhook-eventsource-svc   ClusterIP   100.64.116.226   <none>        12000/TCP   6m

k get eventsources.argoproj.io
NAME      AGE
webhook   10m
eventsource-name=webhook label 이 붙는다. owner나 이런 저런것도 붙는다.
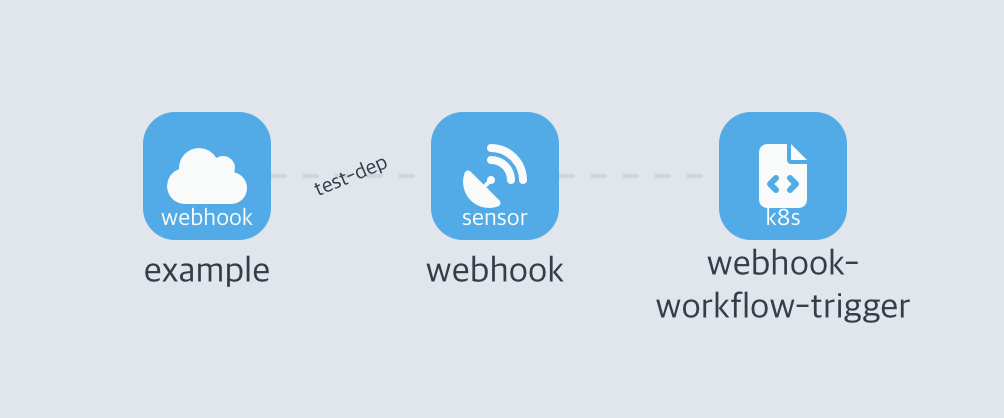
그럼 이제 Sonser를 배포할거다. 이벤트소스를 통해 전달받은 웹훅을 센서가 받아서 트리거를 호출하고 실행한다.
k apply -f Argo-Sensor-Webhook.yaml
sensor.argoproj.io/webhook created
배포가 완료되면
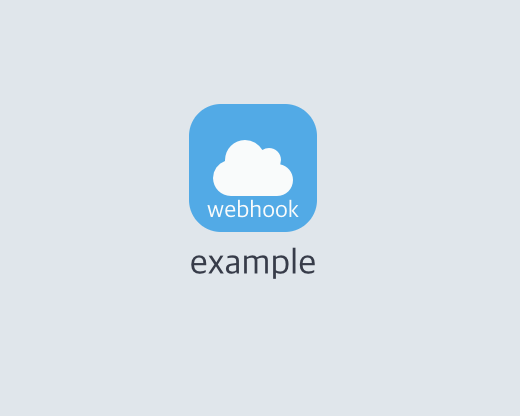
이렇게 Argo WorkFlow UI에서 확인할수 있다. 그럼 웹훅까지 발생시켜 보자.
웹훅도 Ingress 로 받을 거다.
k get svc
NAME                        TYPE        CLUSTER-IP       EXTERNAL-IP   PORT(S)                      AGE
argo-server                 ClusterIP   100.68.95.174    <none>        2746/TCP                     37m
eventbus-default-stan-svc   ClusterIP   None             <none>        4222/TCP,6222/TCP,8222/TCP   64m
webhook-eventsource-svc     ClusterIP   100.64.116.226   <none>        12000/TCP                    14m
Service를 보면 webhook-eventsource-svc Eventsource 가 있다. 이걸 Ingress 로 연결해야한다. Ingress 를 생성하면 이런식으로 두개의 Ingress 가 생긴다.
k get ingress
NAME                       CLASS   HOSTS   ADDRESS                                                                    PORTS   AGE
argo-eventsource-ingress   alb     *       k8s-argo-argoeven-44fe46d880-57919429.ap-northeast-2.elb.amazonaws.com     80      26s
argo-ingress               alb     *       k8s-argo-argoingr-17062136f1-1802335500.ap-northeast-2.elb.amazonaws.com   80      44m
그럼 argo-eventsource-ingress 쪽으로 웹훅을 날려보자.
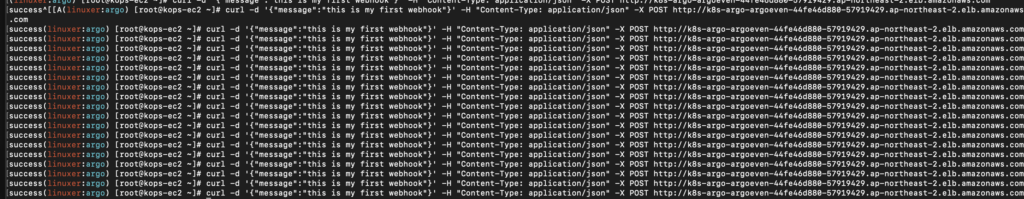
curl -d '{"message":"this is my first webhook"}' -H "Content-Type: application/json" -X POST http://k8s-argo-argoeven-44fe46d880-57919429.ap-northeast-2.elb.amazonaws.com
success
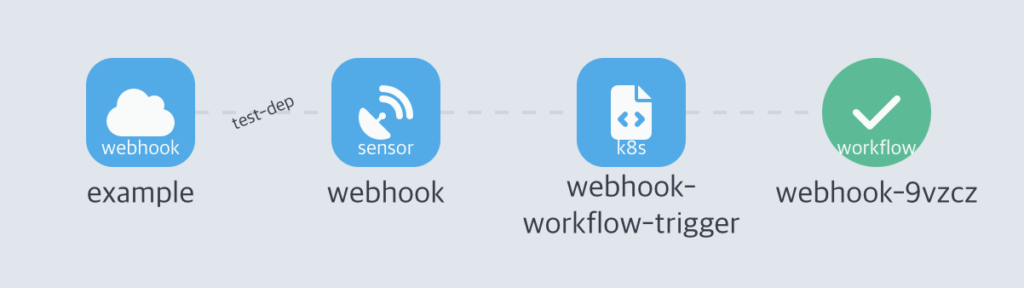
success가 떨어질것이다. 그럼 정상적으로 실행됬는지 UI에서 확인해보자.
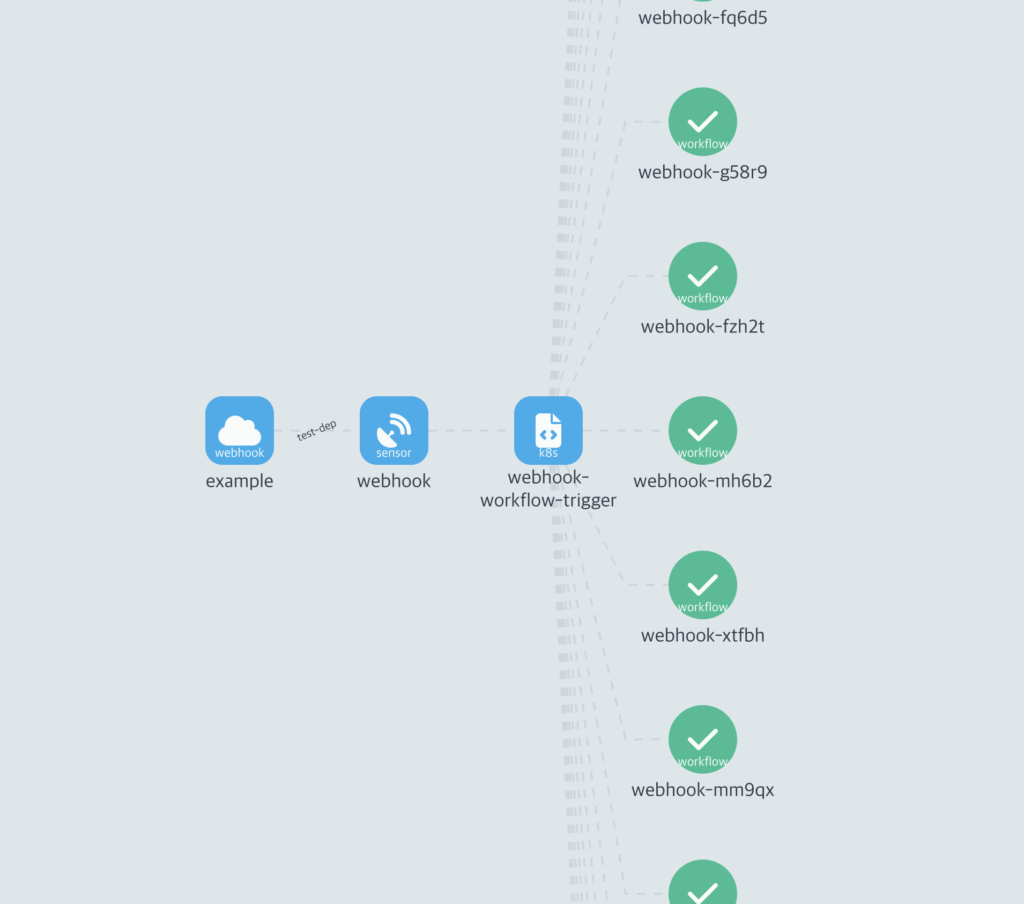
WorkFlow가 생성된게 보인다. 그럼 이걸 CLI 에서도 확인해보자.
k get wf
NAME            STATUS      AGE   MESSAGE
webhook-9vzcz   Succeeded   88s