오랜만의 자격증 글입니다.
최근에 책한권을 추천받았습니다.
기계학습을 다시묻다 라는 책이었습니다.
이광근 교수님의 번역에 대한 생각과 이해를 볼수있는 책이었습니다.
이 책을 읽으면서 너무너무너무너무 이해가 안갔습니다.
그 동안 머신러닝을 지속적으로 찍먹을 하던터라 읽을만 하지 않을까? 했는데 아니나 다를까 수포자에겐 자비가 없었습니다.
그렇지만, 근일년간 쿠버네티스와 머신러닝을 찍먹하면서 내가 머신러닝을 실무에 적용하고 쓸수있는 레벨은 아니지만 어떤기술이 어디서 사용된다 정도는 이해하고 있던터라 한번 과감하게 시험날자를 잡았습니다.
등급: Specialty
시간: 시험 완료까지 180분 소요
비용: 300 USD
형식: 65개 문항, 다항 선택 또는 복수 응답
제공 방법: Pearson VUE 및 PSI. 테스트 센터 또는 온라인 유감독 시험
12월 24일 아침9 시 였습니다.
저의 시험의 시작은 보통 Jayendra 님의 블로그입니다.
AWS에서 제공하는 연습시험 준비
https://docs.aws.amazon.com/ko_kr/sagemaker/latest/dg/algos.html
Sagemaker의 알고리즘표
기본적으로 AWS Docs/FAQ 찬찬히 여러번 읽는것부터 추천
저는 sagemaker의 핸즈온을 해본적이 있고, AWS에 익숙한 편이라 알고리즘 부분을 빼면 대부분 아주 수월하게 읽을 수 있었습니다.
jayendra 님의 정리된 내용이 너무 간결하고 좋아서 깊이있는 이해나 UI에서 어떤것들을 지원하는지 보면됩니다.
그리고 대망의 22일 연습시험을 봤습니다.

| Jeong Taehwan님, 안녕하세요? |
| AWS Certified Machine Learning - Specialty Practice 시험에 응시해 주셔서 감사합니다. 다음 정보를 살펴보고 준비가 더 필요한 주제를 확인하십시오. |
| 총점: 55% |
| 주제별 채점: 1.0 Data Engineering: 100% 2.0 Exploratory Data Analysis: 60% 3.0 Modeling: 25% 4.0 Machine Learning Implementation and Operations: 75% |
아아..이것이 탈락의 느낌인가..
예..22일 연습시험이 55%로 너무 불안했습니다.
그리고 그 다음날은 약속도 있어서 예상한 만큼 공부를 할수있을지도 몰랐습니다.
그 불안감이 점점 커져가며 저를 긴장하게 만들었고, 집중할수 없는 순간에도 알고리즘을 찾아보며, 내가 뭘모르는지를 이해하기 위해 힘썼습니다. 그리고 시험은 AWS 오프라인 시험을 봤습니다.
결과는!!
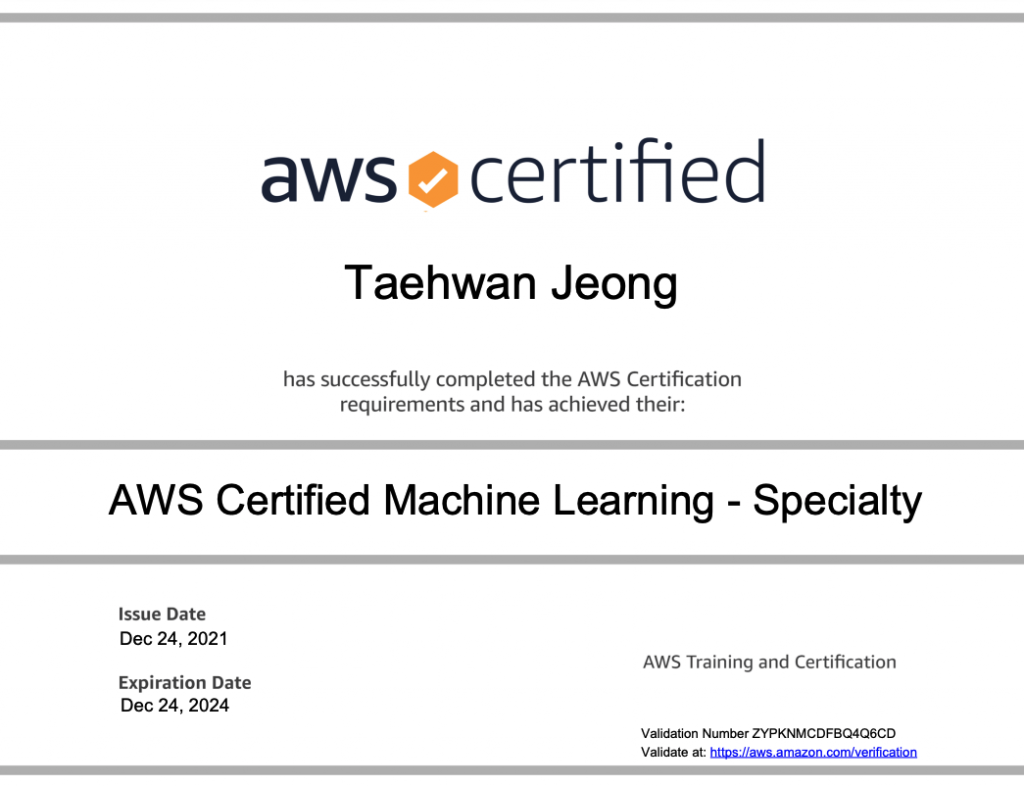
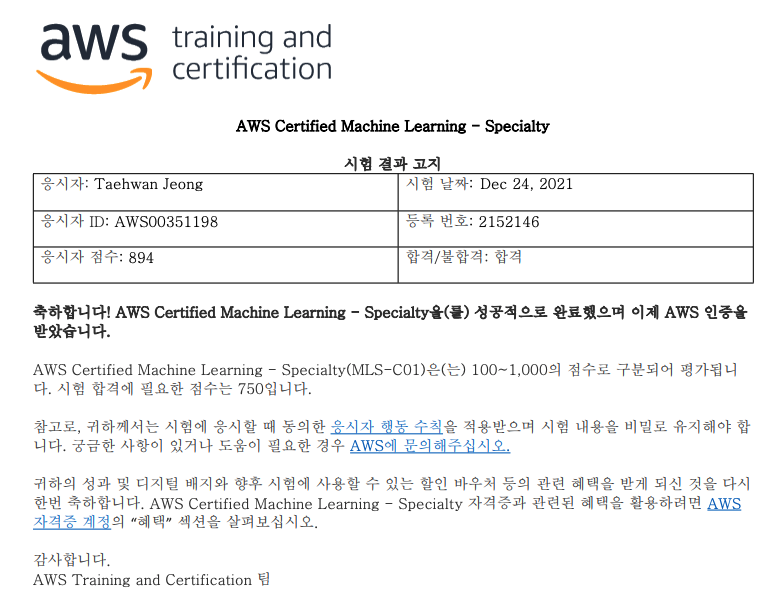
894점으로 합격할수 있었습니다.

이로서 AWS의 10번째 자격증을 획득하였습니다.
읽어주셔서 감사합니다.