우리가 흔히 알고있는 DevOps는 Development 과 operations 의 합성어 이다. FinOps는 이 DevOps 에 Finance를 더한것이다. ( Finance + Development + Operations ) IT infra 상에서 발생하는 비용을 제어하고 투자하는 방식을 말하는것이다.
'투자' 라고 말하면 의아 할수도 있는데 클라우드 상의 자원은 무한하지만 사용자에게 할당된 비용은 유한하다. 그렇기에 제한된 비용내에서 적절한곳에 맞는 리소스를 투입하는것이 FinOps 에서 투자인것이다.
FinOps의 목적은 절약이 아니다. FinOps는 제한적인 예산에서 낭비되는 비용을 줄여 리소스가 필요한곳에 투입하는것이 FinOps 목적인 것이다. 절약에서 '만' 끝난다면 지속적으로 줄여야하는 비용의 압박에 씨달릴 것이다.
또한 비용관리는 반드시 필요하나, 이 비용관리가 비즈니스의 편의성을 해치고, 확장성과 탄력성에 영향을 준다면 당신을 FinOps를 잘못이해 하고있는것이다.
예를 들어 RI를 구매 후 워크로드가 변화에도 불구하고 RI때문에 유연한 리소스를 사용하지 못한다면 잘못된 방식의 비용관리를 하고 있는 것이다. RI 때문에 서버추가에 대한 고민이나 원하는 유형의 인스턴스를 사용하지 못한다는 것은 클라우드를 사용하는 방식도 아니며, 이런경우 차라리 On-Premises로 의 회귀가 더 저렴할것이며 사용패턴도 맞을것이다.
차후 포스팅 할 내용에서는 먼저 가장 간단히 보고 절약할 부분부터 새로운 아키텍처가 필요한 부분까지 작성할 것이다.
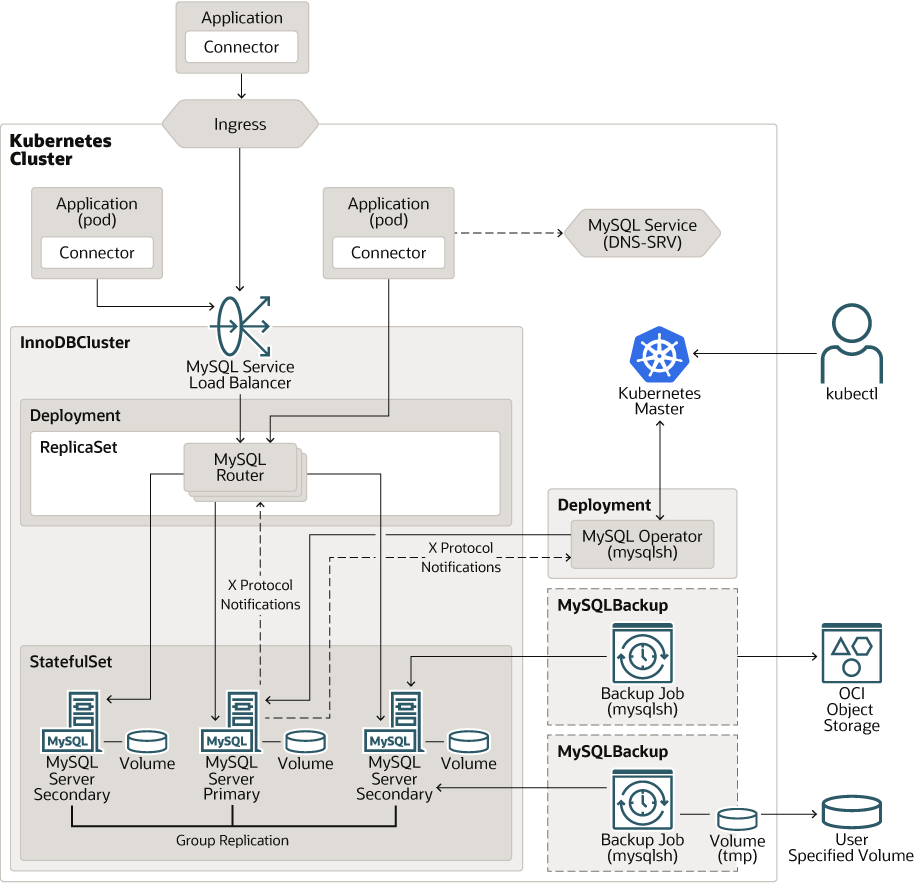
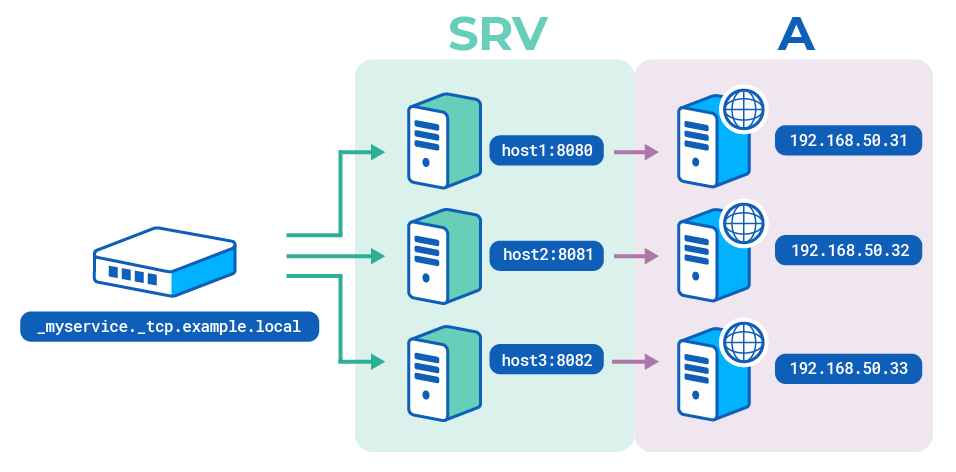
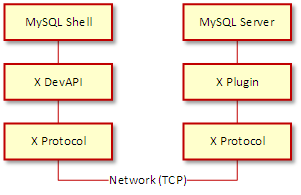
SRV레코드를 이용하여 Endpoint를 특정하고, X protocol을 이용하여 헬스체크를 하고, 문제가 생기면, 오퍼레이터가 파드를 다시 생성하는 등의 과정이 이루어 진다. 말로는 정말 간단하다. 하지만 이 아키텍처가 쿠버네티스의 탄력성과 신속성과 합쳐짐으로 강력한 시너지를 발생하는것으로 보인다.
사용자의 고민이 많이 없이 사용할수있는 레벨의 솔루션으로 진화한듯싶다.
그간 많은 엔지니어 들이 사랑하던 Mysql 의 진화가 반갑기만하면서..오라클의 품에 있는 My가 두렵다.
이제 프로비저너 셋팅이 좀 필요하다. 가시다님께서는 친절하게 프로비저너 셋팅도 다해주셨지만 나는 내가만든 NFS 서버를 사용할거기 때문에 프로비저너를 다시 배포할거다.
#지우고
helm delete -n kube-system nfs-provisioner
#다시 설치하고
helm install nfs-provisioner -n kube-system nfs-subdir-external-provisioner/nfs-subdir-external-provisioner --set nfs.server=nfs-service.default.svc.cluster.local --set nfs.path=/exports
NAME: nfs-provisioner
LAST DEPLOYED: Thu May 26 16:10:31 2022
NAMESPACE: kube-system
STATUS: deployed
REVISION: 1
TEST SUITE: None
🐤
응 잘됬다.
(🐤 |DOIK-Lab:default) root@k8s-m:~# k get svc
NAME          TYPE        CLUSTER-IP   EXTERNAL-IP   PORT(S)            AGE
kubernetes    ClusterIP   10.200.1.1   <none>        443/TCP            4h30m
nfs-service   ClusterIP   None         <none>        2049/TCP,111/UDP   6m29s

(🐤 |DOIK-Lab:default) root@k8s-m:~# k get ep
NAME          ENDPOINTS                            AGE
kubernetes    192.168.10.10:6443                   4h30m
nfs-service   172.16.158.2:2049,172.16.158.2:111   6m48s

(🐤 |DOIK-Lab:default) root@k8s-m:~# k get pod -o wide
NAME             READY   STATUS    RESTARTS   AGE    IP             NODE     NOMINATED NODE   READINESS GATES
nfs-server-pod   1/1     Running   0          7m1s   172.16.158.2   k8s-w1   <none>           <none>
매번 하는 말이지만 내 게으름 때문이다. 꼭 누군가에게 도움이 되는 글을 작성하고 싶었는데 그게 바로 오늘인 듯 하다.
클라우드를 하려면 먼저 계정을 생성하여야 한다.
계정을 생성 하였는가? 축하한다. 드디어 클라우드에 입문한 셈이다.
클라우드는 보통 웹 콘솔로 처음 접하게 된다. CSP 에서 제공하는 웹사이트에 가입을 했다면 뭘 해야 할지 고민이 될 것이다.
모든 설명은 AWS를 기준으로 작성된다.
걱정 마라.
처음 가입하면 뭘해야 할지 바로 알려주겠다.
MFA
Budget
Root 계정 봉인
3가지의 조치가 왜필요한지 이야기해 보겠다.
먼저 MFA를 하지 않아 털리게된다면 공격자는 AWS Console을 편하게 이용할 수 있다. 걸리기 전까지 컴퓨팅을 마음껏 쓸수 있는것이다. 이렇게 털린 계정은 전적으로 사용자 과실이다.
길바닥에 떨어진 지갑은 일반적인 사회라면 경찰서에 가져다주고 주인을 찾아 주겠지만, 그렇지 않은 경우도 많다. 그 길바닥에 떨어진 지갑이 바로 당신의 클라우드 계정이다. 작게는 수백 크게는 수억원까지 비용이 발생할수 있다. 이러한 대 참사를 막기위한 조치이다.
루트계정의 MFA를 설정하여 접근을 막고, 예산을 설정하여 비용이 초과되면 알럿을 받고, 루트계정을 사용하지 않는 방법과 역할 전환을 이용하여 계정의 보안을 강화하는 방법이 가장 적절한 방법인것이다. 여기에 리소스가 생성되면 알림을 받는것도 좋고, 사용하지 않는 태그를 기반으로 리소스가 생성되면 자동으로 삭제하는 방식도 좋다. 이런 여러가지 방식들이 있지만 가장 기본적인 방법이 위에서 제시한 세가지의 방법이다. 그럼 바로 시작하겠다.
MFA
라온클님 역작
MFA를 생성하기 전에 먼저 물어볼것이 있다. 혹시 메일주소가 다른 계정이나, 패스워드가 겹치진 않는가? 이건 굉장히 중요한 문제다. 계정이 다른 아이디 나 패스워드가 겹친다면 삭제하고 처음부터 다시 만들자. 자주사용하는 아이디와 패스워드는 유출될 확률이 높다. 물론 MFA를 사용하면 안전하다. 하지만 언제나 방심하는 순간 문제가 발생한다. 그러니, 콘솔용 메일주소는 별도로 사용하는것이 좋다.
이제 그럼 MFA를 걸어보자.
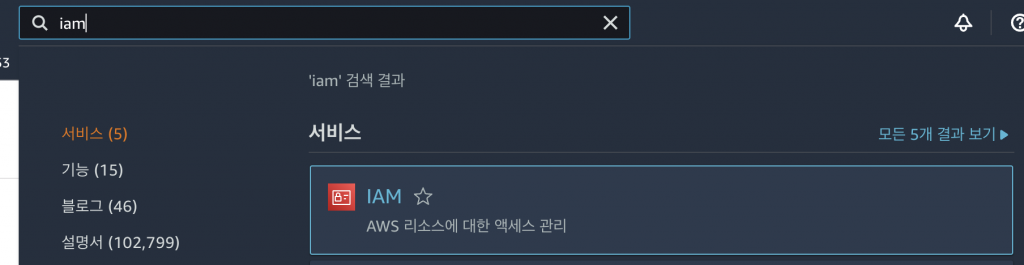
IAM 서비스로 이동한다 Root 계정의 MFA도 IAM에서 설정할수 있다.
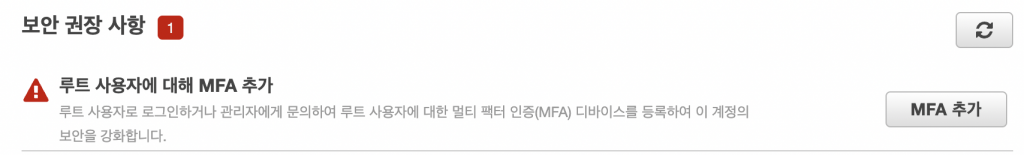
MFA는 사용하지 않으면 IAM 대시보드에 바로 경고가 떠있다. MFA 를 생성하자.
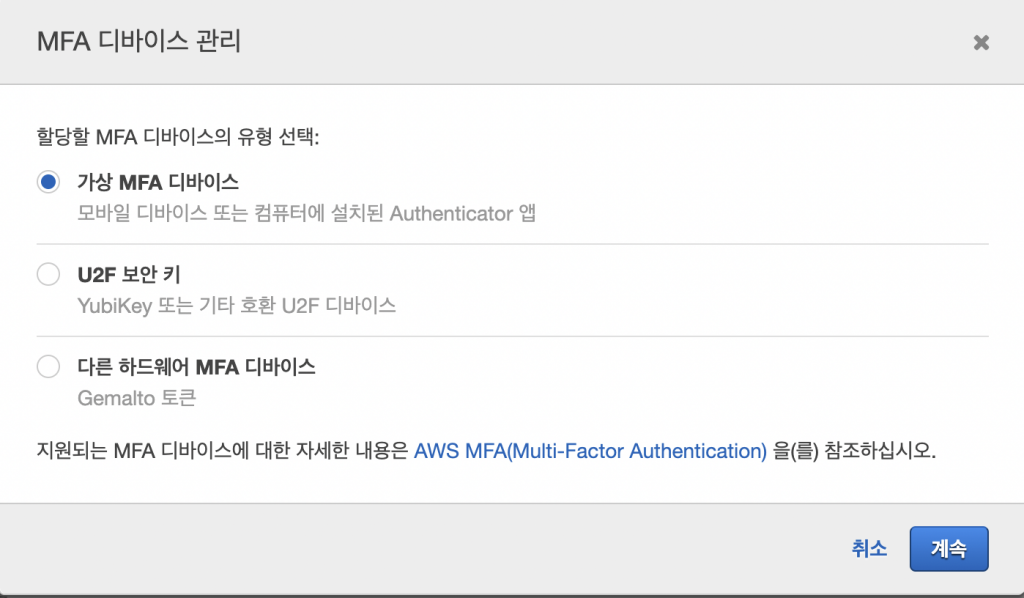
가상 MFA 디바이스를 선택한다.
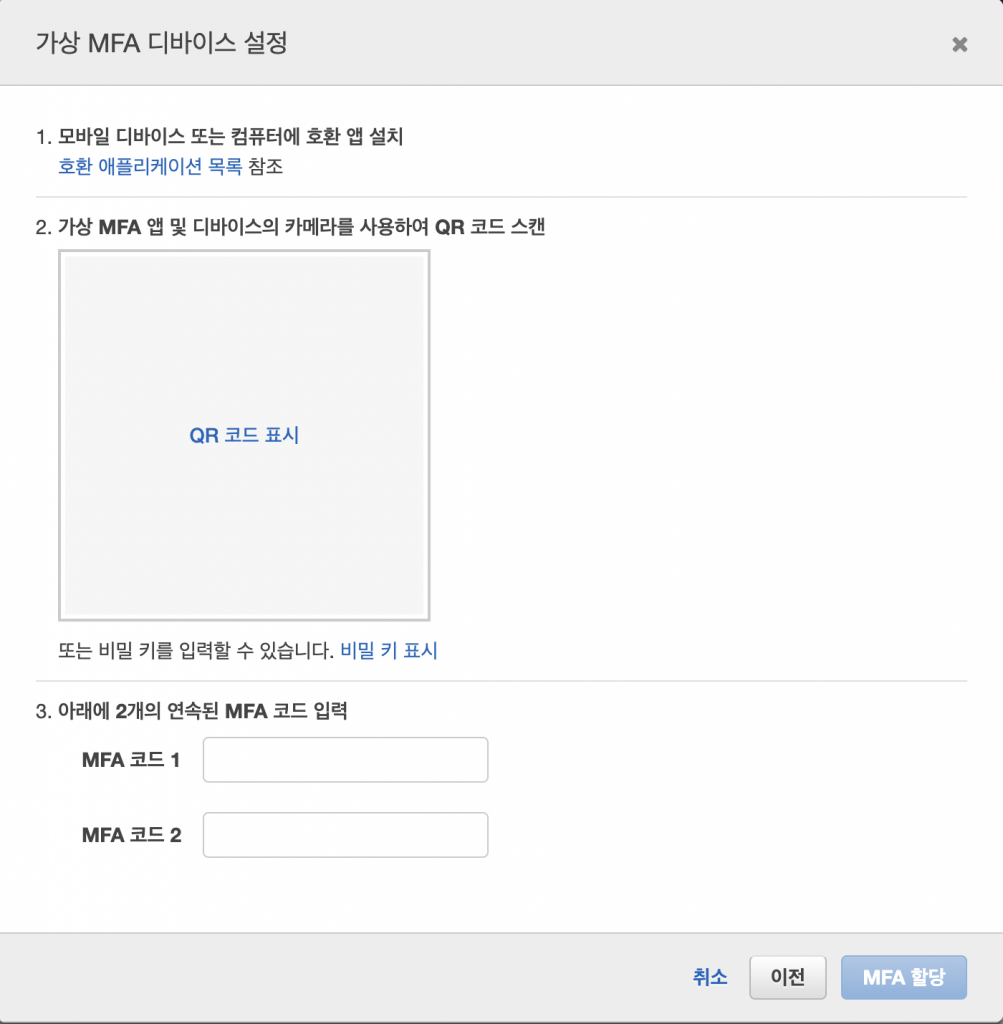
MFA는 여러 어플이 있는데 나는 MS에서 만든 어플을 선호한다. 온라인백업 기능을 지원한다. QR코드 표시 누르고 그이미지를 백업해두어도 나중에 MFA를 다시추가 가능하다. 하지만 보안이 매우 좋지않음으로 추천하지 않는 방법이다. 보관하려면 압축후 비밀번호를 걸어서 보관하라.
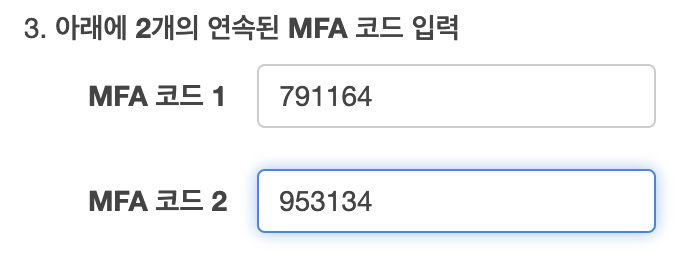
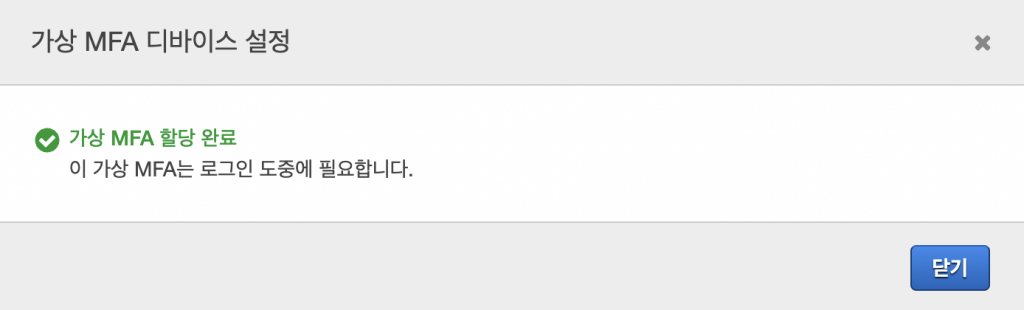
연속된 MFA를 입력하라는건 6자리를 두번 입력해야한다.
두번 입력하면 MFA 설정이 완료된다.
이 쉬운 과정이 일단 그대의 콘솔이 털리는걸 막아주는거다. 로그인이 불편하더라도 꼭 사용하길 바란다.
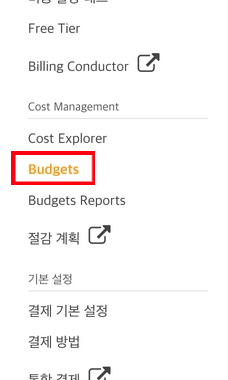
Budget
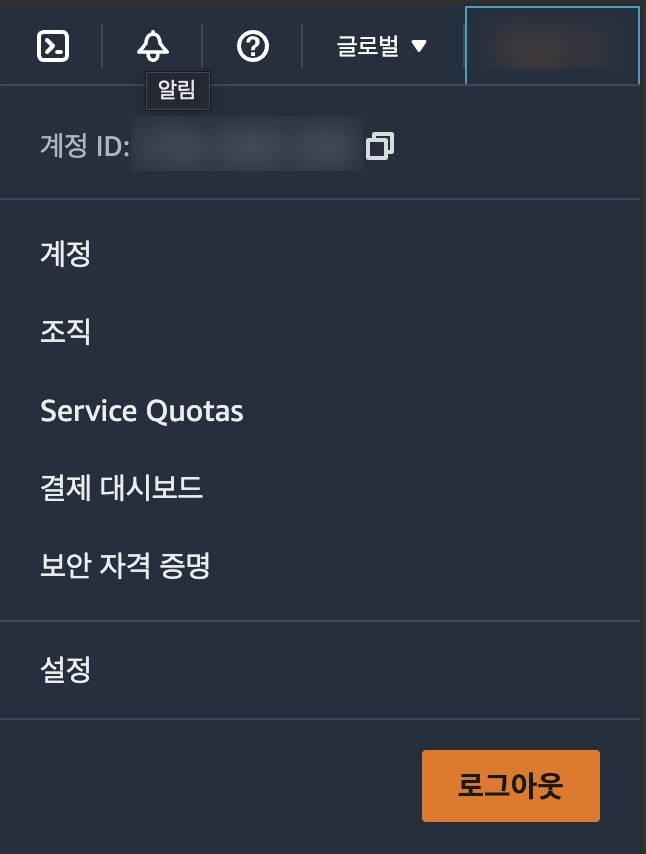
Budget 설정은 결제 대시보드에 있다.
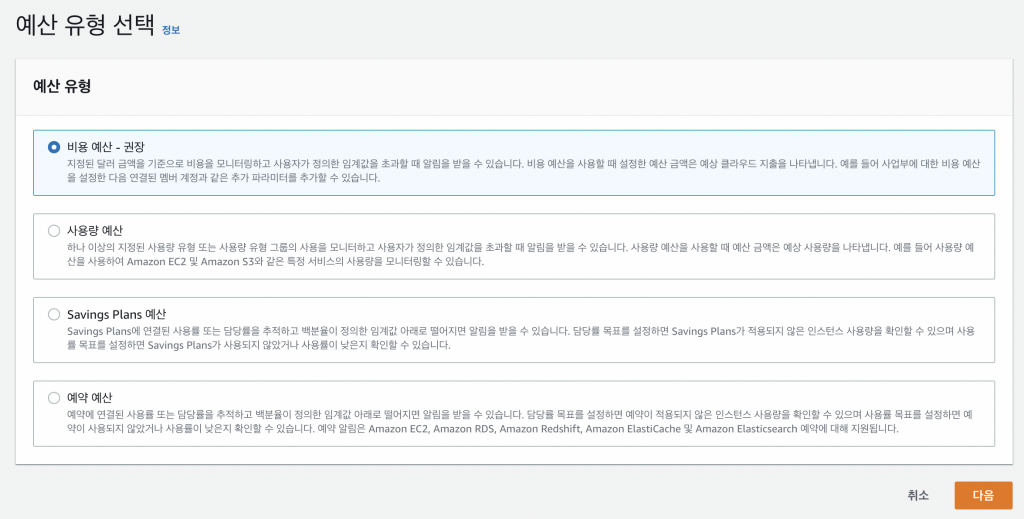
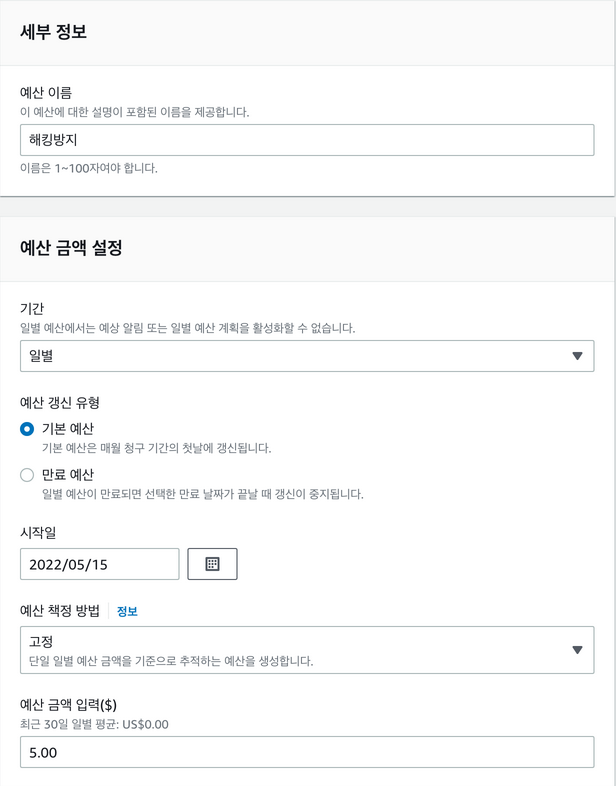
예산은 설정하면 알럿이 온다. 예산을 작성하도록 하자.
예산 관련 옵션 들은 FinOps를 위한 여러가지 기능을 제공하는데 우리는 그냥 비용 예산을 작성하면 된다.
일별로 변경후 5$를 설정한다 프리티어에서 하루 5$를 넘으면 대참사다. 한번 만들고 알럿이 귀찮으면 서서히 조정하자.
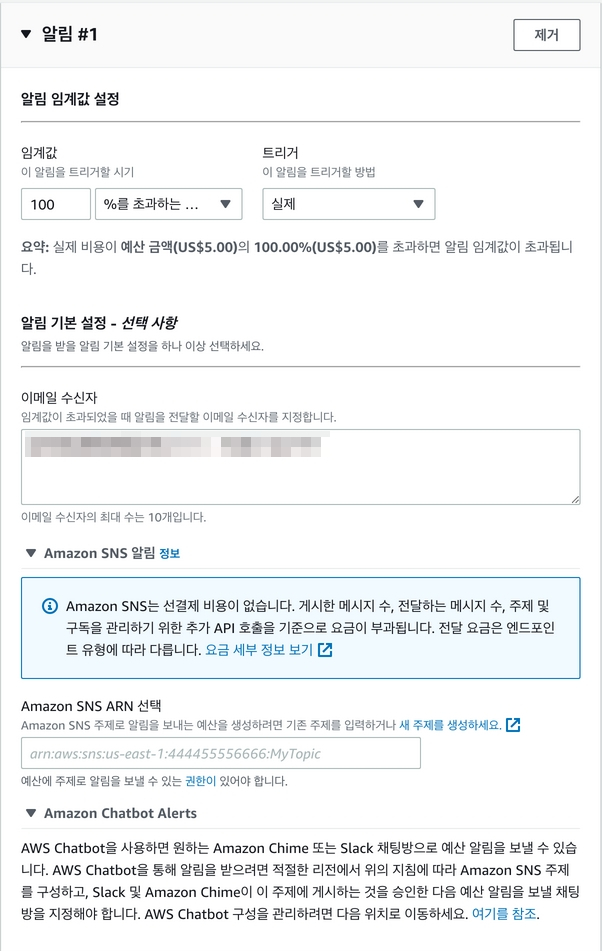
이메일 수신자에 받고싶은 이메일을 넣어도 되고 SNS 에 주제와, 구독을 생성하여 SMS등으로 받을수도 있으며, Chatbot Alerts를 이용하여 슬랙등 여러 Bot으로 알럿을 받을수 있다. 이메일은 무료고 뒤의 두가지는 비용이 발생할수 있으므로 메일로 받고 관리해야하는 서비스라면 봇이나 SNS를 이용하길 바란다.
이후 예산을 작성하면 이제 일정이상 비용이 넘으면 알럿이 발생한다.
벌써 두가지의 조치를 했다. 남은 두가지만 하면된다.
Root 계정 봉인
Root 계정은 많은 참사를 불러 온다. 이 대 참사를 막기위한 방법이 있다. Root 계정에 MFA를 걸어서 안전하다고 생각할지 모르나, 문제는 언제 어디서 발생할지 모른다. 그렇기에, Root 계정을 봉인하는것을 추천한다.
Root 계정을 사용하지 않고 어떻게 AWS를 안전하게 사용하는지 알려주겠다.
이 방법에는 두가지가 필요하다.
IAM User
IAM Role
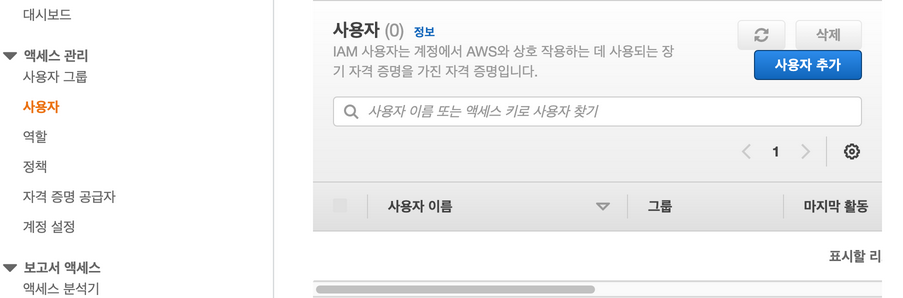
먼저 로그인 통로가 될 User를 생성한다. IAM에서 사용자를 추가하면 된다.
IAM 서비스로 이동하고 사용자탭으로 이동해서 사용자 추가를 누른다.
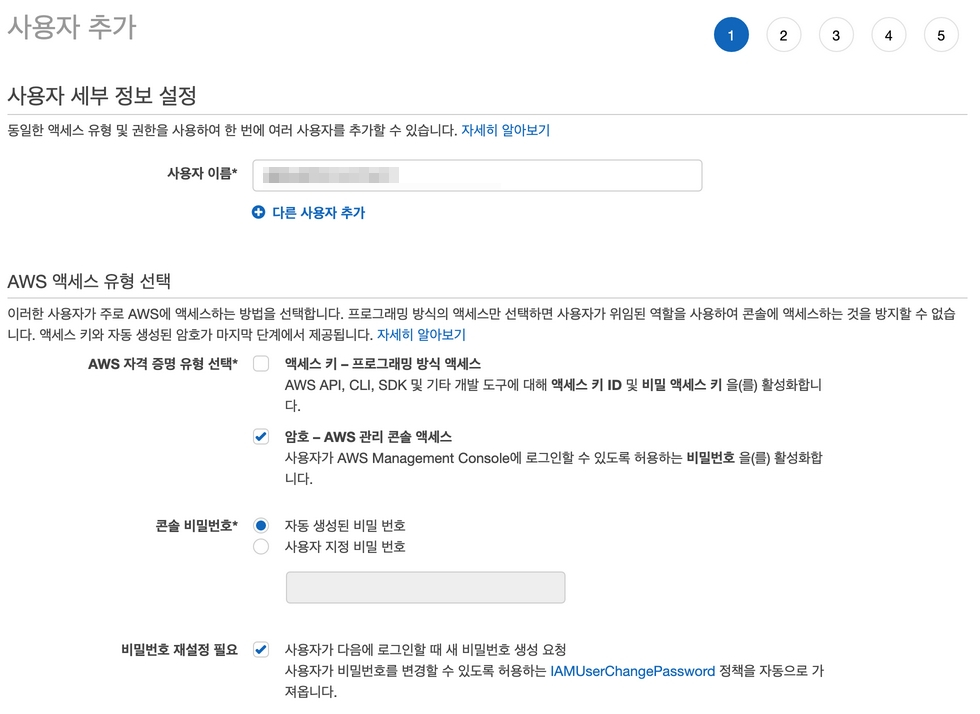
액세스키 방식이 아닌 AWS 관리 콘솔 액세스를 선택한다.
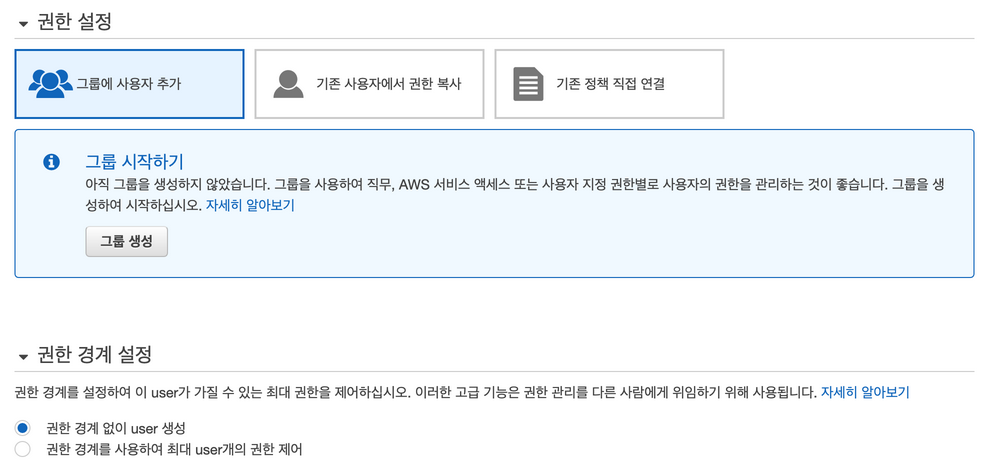
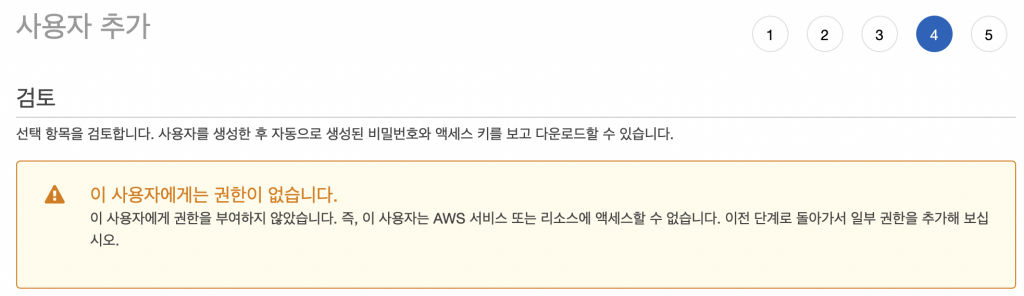
이 계정엔 아무 권한도 주지 않을 것이다.
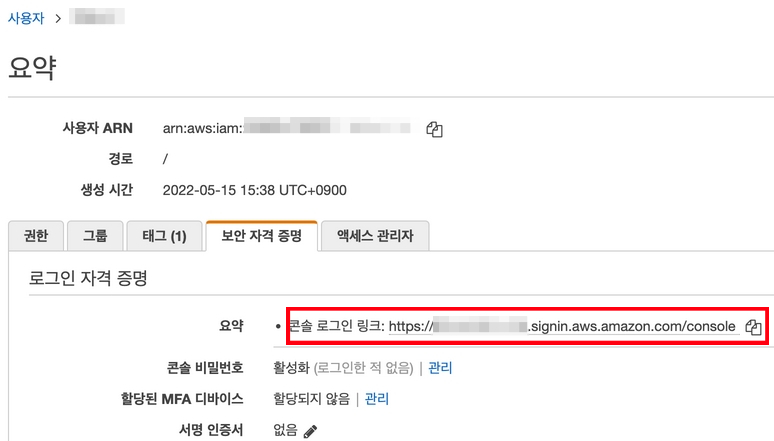
이렇게 나와야한다. 계정을 생성 완료 했다면 계정의 요약에서 보안 자격 증명을 눌러보자.
콘솔 로그인 링크로 로그인하기 전에 먼저해야할 것이 있다.
MFA다.(궁서체다 매우진지하므로 추가해라.)
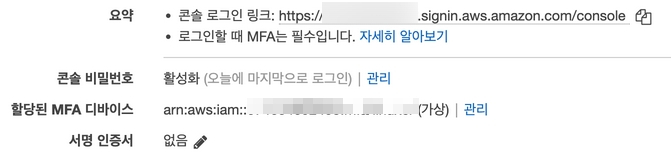
MFA는 최대한 활용한다.
이상태가 되면된다. 이제 요약에서 보여주는 콘솔링크로 AWS를 이용한다. 한번 로그인해보시라.
이 아무 권한도 없는 계정은 이제 방파제가 되어 로그인을 제어해줄것이다. 권한이 없는 계정으로 뭘하는지 궁금할것이다. 이때 필요한것이 역할 전환이다. 그럼 IAM Role을 생성하자.
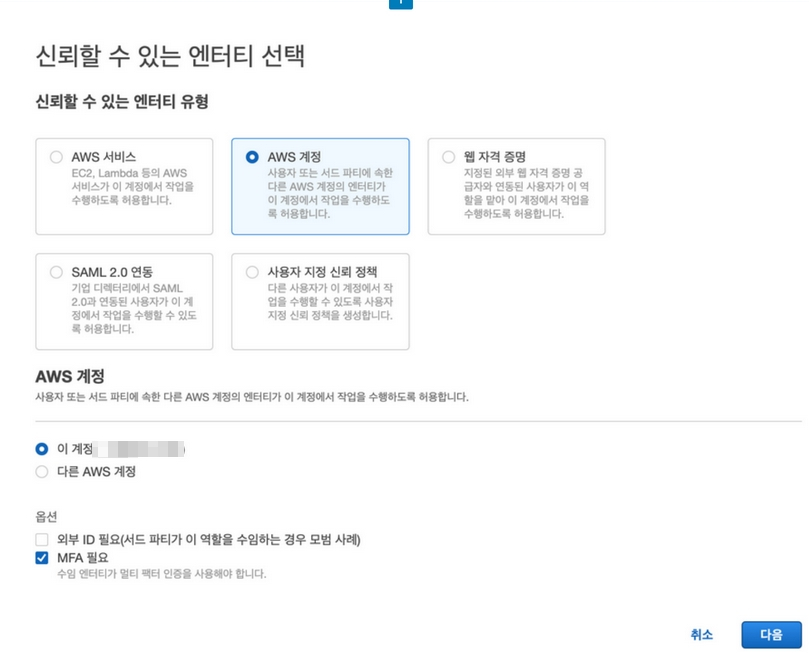
IAM에서 역할탭으로 이동한다. 역할 만들기를 누르자.
다음과 같이 체크해준다.
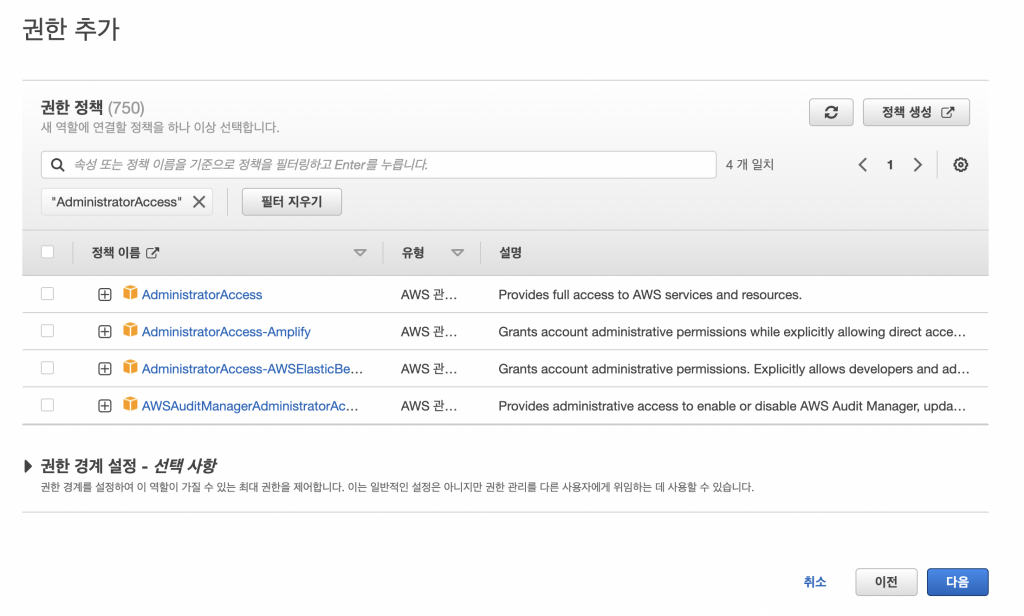
권한은 여기서 최대 권한을 주지만, 사용자에 맞게 권한을 주는것이 더 적절하다.
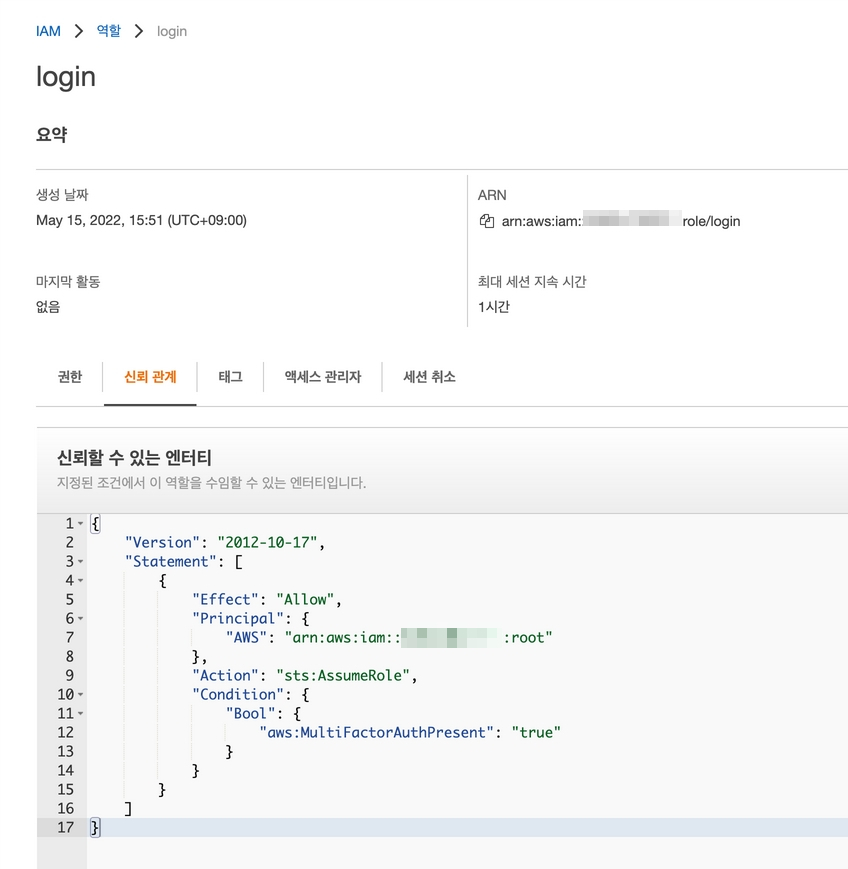
역할을 생성하고 이 역할을 사용할수 있도록 수정을 해야한다.
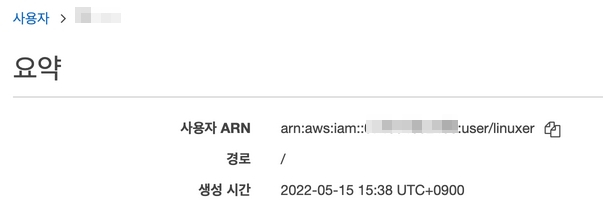
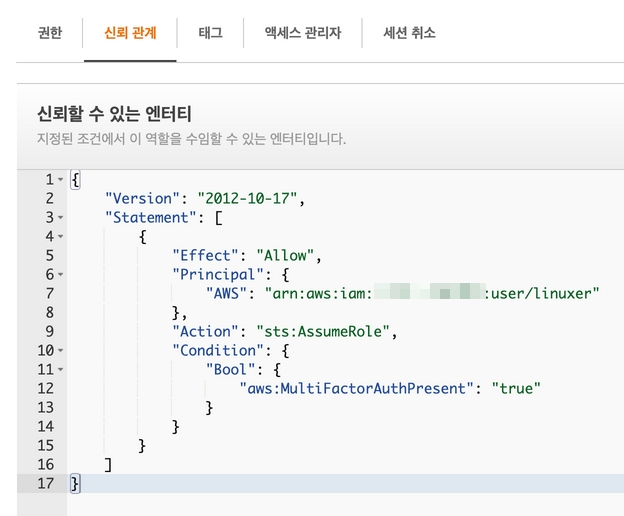
여기서 "arn:aws:iam::00000000000:root" 를 수정해야한다. 수정할 값은 아까만든 계정의 ARN이다. 사용자탭으로 이동해서 계정을 눌러보면
다음과 같이 ARN을 확인할수 있다. 하지만 ARN은 규칙이 있어서 보지않고 그냥 수정해도 된다. 다시 역할로 돌아와서
신뢰관계를 수정하면 이제 생성했던 계정이 이 역할을 사용할수있다. 덤으로 MFA가 활성화 되어야지 만 이 역할을 사용할수 있다.
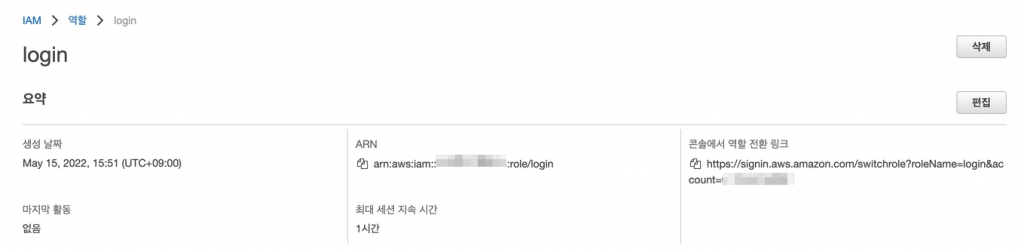
그럼이제 이 역할을 사용하는 방법은 바로전에 생성한 계정으로 로그인하고, 생성한 역할의 요약 탭에서 보여주는 역할전환 링크를 통해 역할을 전환한다.
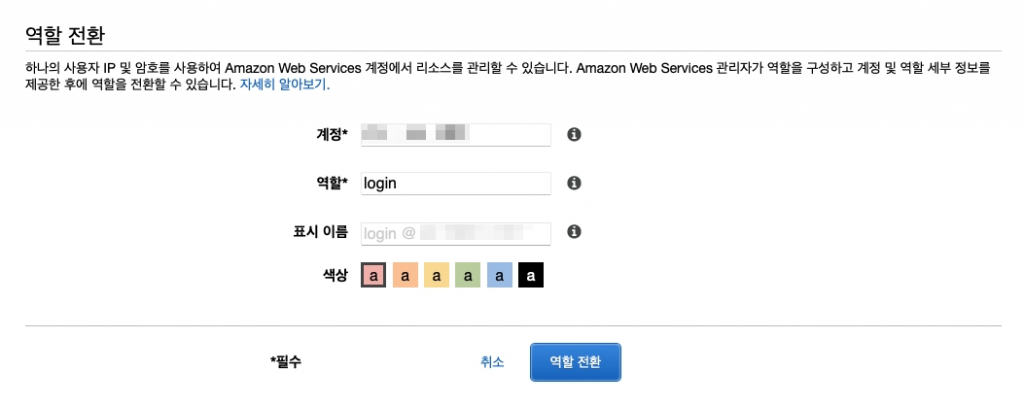
다음메뉴에서 역할의 세션지속기간을 설정할수 있다. 역할전환 링크로 이동하면
다음과 같은 화면을 마주하게 되고, 역할 전환을 누르면 이제 IAM 사용자가 역할전환을 이용하여 AdministratorAccess 권한을 승계받은거다. 이제 해커는 MFA를 획득 하더라도 역할전환을 하지 못하면 어떠한 행위도 할 수 없다.
일반적으로 이 방식은 타 계정에서 어카운트를 생성하지 않고 로그인할때 사용하는 방식이다. 혹시 관리계정이 있다면 그관리계정에서 역할전환을 하는것이 더욱 권장되는 방식이다.