AWS-SQS-터져랏

일단 SQS를 터질때 까지 밀어넣어 보기로 했다.

목표 메시지수는 100만건.

100만건의 메시지를 100초안에 SQS에 넣는게 목표다. TPS 10000 이라는 소리다.

목표를 이루기위해선 첫번째 SQS의 TPS는 3000이다. 초당 3000의 메시지를 넣을수 있다.

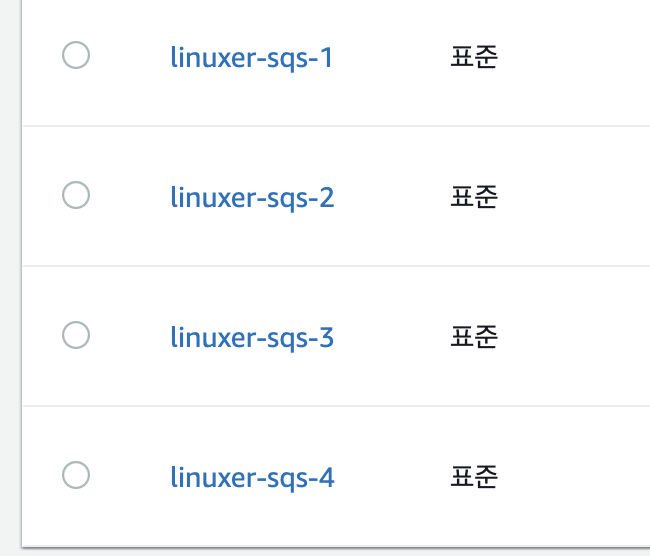
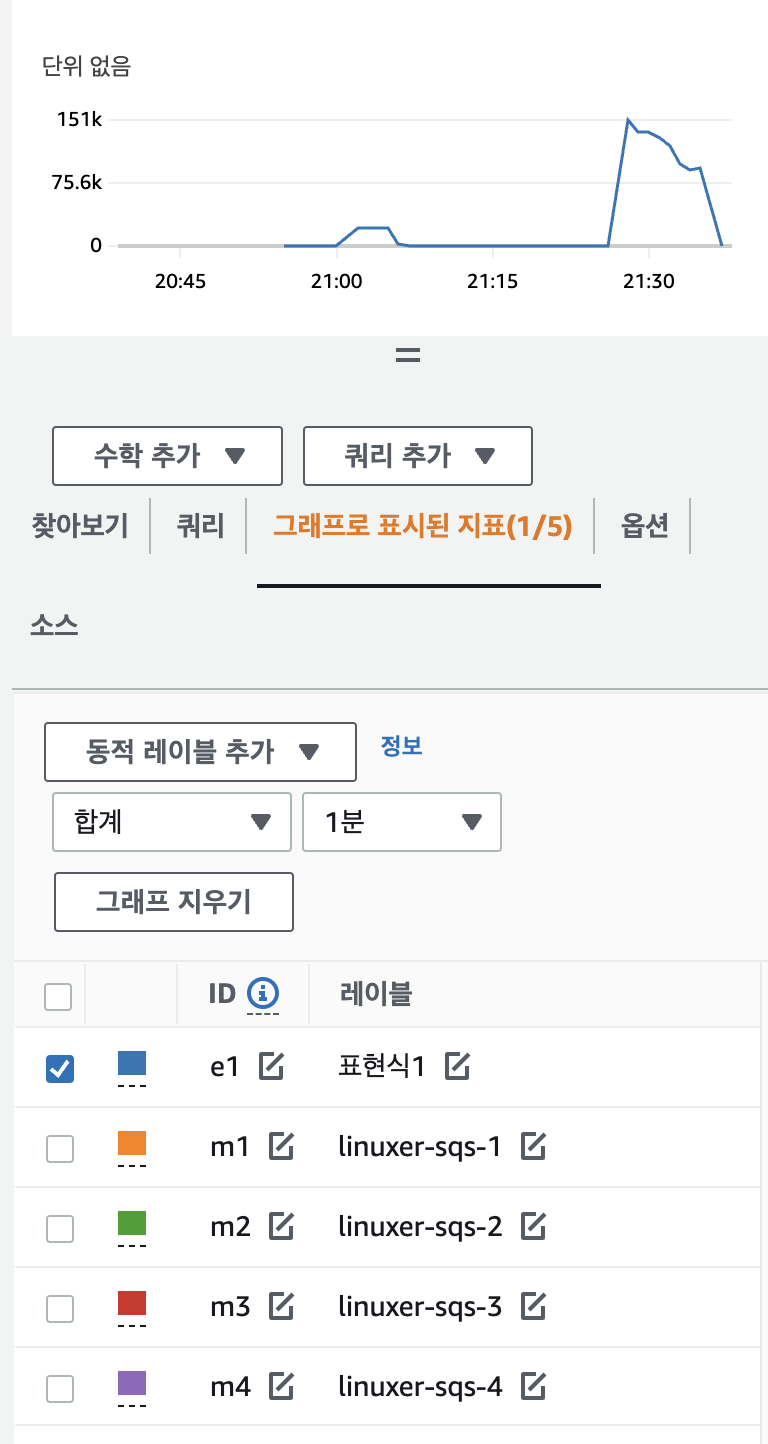
먼저 큐를 4개를 만들었다. 목표수치에 가려면 TPS가 10000은 나와야한다.

그렇다면 큐를 병렬로 줄세운다 4개의 큐를 만든다.

이제 넣어봤다.

import boto3
import json
import uuid
from concurrent.futures import ThreadPoolExecutor
import random
import string

sqs = boto3.client('sqs')
queue_urls = [
    'linuxer-sqs-1',
    'linuxer-sqs-2',
    'linuxer-sqs-3',
    'linuxer-sqs-4'
]

def random_string(length):
    return ''.join(random.choices(string.ascii_letters + string.digits, k=length))

def create_dummy_data():
    return {
        'id': str(uuid.uuid4()),
        'data': f"host-{random_string(5)}-count",
        'padding': random_string(10 * 1024 - 100)  # 10KB 크기의 더미 데이터를 생성
    }

def send_message_batch(queue_url, messages):
    entries = []

    for idx, message in enumerate(messages):
        entries.append({
            'Id': str(idx),
            'MessageBody': json.dumps(message)
        })

    response = sqs.send_message_batch(
        QueueUrl=queue_url,
        Entries=entries
    )
    return response

def generate_and_send_dummy_data(num_messages=100000, batch_size=10, num_threads=10):
    with ThreadPoolExecutor(max_workers=num_threads) as executor:
        for _ in range(num_messages // (batch_size * num_threads * len(queue_urls))):
            batch_futures = []
            for queue_url in queue_urls:
                messages = [create_dummy_data() for _ in range(batch_size)]
                future = executor.submit(send_message_batch, queue_url, messages)
                batch_futures.append(future)

            for future in batch_futures:
                future.result()

if __name__ == '__main__':
    generate_and_send_dummy_data()

대충 이코드는 TPS 100 정도이다.

5분 정도 걸려서 10만 건의 메시지를 모두 PUT했다. 분당 20000 TPS 333정도다.

병렬처리했다.

import boto3
import json
import uuid
from concurrent.futures import ThreadPoolExecutor
from multiprocessing import Process
import random
import string

sqs = boto3.client('sqs')
queue_urls = [
    'linuxer-sqs-1',
    'linuxer-sqs-2',
    'linuxer-sqs-3',
    'linuxer-sqs-4'
]

def random_string(length):
    return ''.join(random.choices(string.ascii_letters + string.digits, k=length))

def create_dummy_data():
    return {
        'id': str(uuid.uuid4()),
        'data': f"host-{random_string(5)}-count",
        'padding': random_string(10 * 1024 - 100)  # 10KB 크기의 더미 데이터를 생성
    }

def send_message_batch(queue_url, messages):
    entries = []

    for idx, message in enumerate(messages):
        entries.append({
            'Id': str(idx),
            'MessageBody': json.dumps(message)
        })

    response = sqs.send_message_batch(
        QueueUrl=queue_url,
        Entries=entries
    )
    return response

def generate_and_send_dummy_data(queue_url, num_messages=1000000, batch_size=10, num_threads=10):
    with ThreadPoolExecutor(max_workers=num_threads) as executor:
        for _ in range(num_messages // (batch_size * num_threads)):
            batch_futures = []
            for _ in range(num_threads):
                messages = [create_dummy_data() for _ in range(batch_size)]
                future = executor.submit(send_message_batch, queue_url, messages)
                batch_futures.append(future)

            for future in batch_futures:
                future.result()

def start_processes(num_processes):
    processes = []
    for queue_url in queue_urls:
        for _ in range(num_processes):
            process = Process(target=generate_and_send_dummy_data, args=(queue_url,))
            processes.append(process)
            process.start()

    for process in processes:
        process.join()

if __name__ == '__main__':
    num_processes = 4
    start_processes(num_processes)
501 17512 16975   0  9:27PM ttys001    0:00.21 /Library/Developer/CommandLineTools/Library/Frameworks/Python3.framework/Versions/3.9/Resources/Python.app/Contents/MacOS/Python main.py
  501 17513 17512   0  9:27PM ttys001    0:00.05 /Library/Developer/CommandLineTools/Library/Frameworks/Python3.framework/Versions/3.9/Resources/Python.app/Contents/MacOS/Python -c from multiprocessing.resource_tracker import main;main(6)
  501 17514 17512   0  9:27PM ttys001    0:14.41 /Library/Developer/CommandLineTools/Library/Frameworks/Python3.framework/Versions/3.9/Resources/Python.app/Contents/MacOS/Python -c from multiprocessing.spawn import spawn_main; spawn_main(tracker_fd=7, pipe_handle=9) --multiprocessing-fork
  501 17515 17512   0  9:27PM ttys001    0:14.50 /Library/Developer/CommandLineTools/Library/Frameworks/Python3.framework/Versions/3.9/Resources/Python.app/Contents/MacOS/Python -c from multiprocessing.spawn import spawn_main; spawn_main(tracker_fd=7, pipe_handle=11) --multiprocessing-fork
  501 17516 17512   0  9:27PM ttys001    0:14.36 /Library/Developer/CommandLineTools/Library/Frameworks/Python3.framework/Versions/3.9/Resources/Python.app/Contents/MacOS/Python -c from multiprocessing.spawn import spawn_main; spawn_main(tracker_fd=7, pipe_handle=14) --multiprocessing-fork
  501 17517 17512   0  9:27PM ttys001    0:14.60 /Library/Developer/CommandLineTools/Library/Frameworks/Python3.framework/Versions/3.9/Resources/Python.app/Contents/MacOS/Python -c from multiprocessing.spawn import spawn_main; spawn_main(tracker_fd=7, pipe_handle=16) --multiprocessing-fork
  501 17518 17512   0  9:27PM ttys001    0:14.55 /Library/Developer/CommandLineTools/Library/Frameworks/Python3.framework/Versions/3.9/Resources/Python.app/Contents/MacOS/Python -c from multiprocessing.spawn import spawn_main; spawn_main(tracker_fd=7, pipe_handle=18) --multiprocessing-fork
  501 17519 17512   0  9:27PM ttys001    0:14.21 /Library/Developer/CommandLineTools/Library/Frameworks/Python3.framework/Versions/3.9/Resources/Python.app/Contents/MacOS/Python -c from multiprocessing.spawn import spawn_main; spawn_main(tracker_fd=7, pipe_handle=20) --multiprocessing-fork
  501 17520 17512   0  9:27PM ttys001    0:14.16 /Library/Developer/CommandLineTools/Library/Frameworks/Python3.framework/Versions/3.9/Resources/Python.app/Contents/MacOS/Python -c from multiprocessing.spawn import spawn_main; spawn_main(tracker_fd=7, pipe_handle=22) --multiprocessing-fork
  501 17521 17512   0  9:27PM ttys001    0:14.11 /Library/Developer/CommandLineTools/Library/Frameworks/Python3.framework/Versions/3.9/Resources/Python.app/Contents/MacOS/Python -c from multiprocessing.spawn import spawn_main; spawn_main(tracker_fd=7, pipe_handle=24) --multiprocessing-fork
  501 17522 17512   0  9:27PM ttys001    0:14.46 /Library/Developer/CommandLineTools/Library/Frameworks/Python3.framework/Versions/3.9/Resources/Python.app/Contents/MacOS/Python -c from multiprocessing.spawn import spawn_main; spawn_main(tracker_fd=7, pipe_handle=27) --multiprocessing-fork
  501 17523 17512   0  9:27PM ttys001    0:14.55 /Library/Developer/CommandLineTools/Library/Frameworks/Python3.framework/Versions/3.9/Resources/Python.app/Contents/MacOS/Python -c from multiprocessing.spawn import spawn_main; spawn_main(tracker_fd=7, pipe_handle=29) --multiprocessing-fork
  501 17524 17512   0  9:27PM ttys001    0:14.24 /Library/Developer/CommandLineTools/Library/Frameworks/Python3.framework/Versions/3.9/Resources/Python.app/Contents/MacOS/Python -c from multiprocessing.spawn import spawn_main; spawn_main(tracker_fd=7, pipe_handle=31) --multiprocessing-fork
  501 17525 17512   0  9:27PM ttys001    0:14.19 /Library/Developer/CommandLineTools/Library/Frameworks/Python3.framework/Versions/3.9/Resources/Python.app/Contents/MacOS/Python -c from multiprocessing.spawn import spawn_main; spawn_main(tracker_fd=7, pipe_handle=33) --multiprocessing-fork
  501 17526 17512   0  9:27PM ttys001    0:14.28 /Library/Developer/CommandLineTools/Library/Frameworks/Python3.framework/Versions/3.9/Resources/Python.app/Contents/MacOS/Python -c from multiprocessing.spawn import spawn_main; spawn_main(tracker_fd=7, pipe_handle=35) --multiprocessing-fork
  501 17527 17512   0  9:27PM ttys001    0:14.18 /Library/Developer/CommandLineTools/Library/Frameworks/Python3.framework/Versions/3.9/Resources/Python.app/Contents/MacOS/Python -c from multiprocessing.spawn import spawn_main; spawn_main(tracker_fd=7, pipe_handle=37) --multiprocessing-fork
  501 17528 17512   0  9:27PM ttys001    0:14.49 /Library/Developer/CommandLineTools/Library/Frameworks/Python3.framework/Versions/3.9/Resources/Python.app/Contents/MacOS/Python -c from multiprocessing.spawn import spawn_main; spawn_main(tracker_fd=7, pipe_handle=39) --multiprocessing-fork
  501 17529 17512   0  9:27PM ttys001    0:14.46 /Library/Developer/CommandLineTools/Library/Frameworks/Python3.framework/Versions/3.9/Resources/Python.app/Contents/MacOS/Python -c from multiprocessing.spawn import spawn_main; spawn_main(tracker_fd=7, pipe_handle=41) --multiprocessing-fork

이제 멀티프로세스로 꼽는다!!

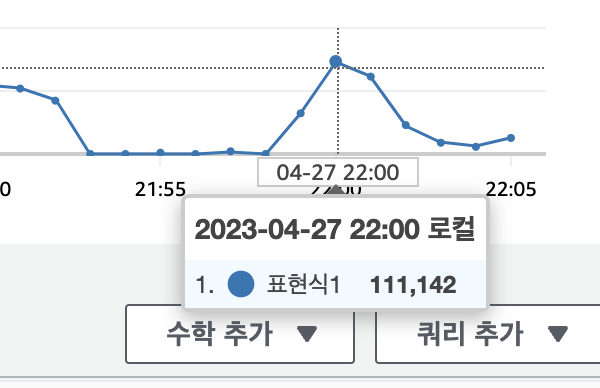
코드보니 400만개를 넣도록 되어있어서 100만개 넣을시점에 끊었다.

10분정도에 100만개의 메시지.. TPS 1600 정도다 아직 더 올릴수 있는 가망성이 보이지만 이건이제 컴퓨팅의 문제다.
이제 병렬처리만으로도 가능함을 알았으니..producer 의 병렬성을 더 올린다. num_processes = 12 4배다! 일단 터트려 보자.

ps -ef | grep "multiprocessing.spawn" | wc -l
      49

49개의 프로세스가 미친듯이 공격을 한다. M1 진짜 좋다.

아...내 노트북으로 낼수있는 TPS는 1600이 한계다. 이제 컨슈밍을 할거다. SQS에 있는 데이터를 꺼내쓰는 속도를 확인할거다. 큐에는 100만개의 데이터가 쌓여있고 이걸 모두 소모하는 속도를 확인하려한다.

import boto3
import time
from concurrent.futures import ThreadPoolExecutor, as_completed
from multiprocessing import Process

sqs = boto3.client('sqs')
queue_urls = [
    'linuxer-sqs-1',
    'linuxer-sqs-2',
    'linuxer-sqs-3',
    'linuxer-sqs-4'
]

def receive_and_delete_message(queue_url, wait_time=20):
    while True:
        response = sqs.receive_message(
            QueueUrl=queue_url,
            AttributeNames=['All'],
            MaxNumberOfMessages=1,
            WaitTimeSeconds=wait_time
        )

        if 'Messages' in response:
            message = response['Messages'][0]
            receipt_handle = message['ReceiptHandle']
            sqs.delete_message(
                QueueUrl=queue_url,
                ReceiptHandle=receipt_handle
            )
        else:
            break

def process_messages(queue_url, num_threads=10):
    with ThreadPoolExecutor(max_workers=num_threads) as executor:
        futures = [executor.submit(receive_and_delete_message, queue_url) for _ in range(num_threads)]
        for future in as_completed(futures):
            future.result()

def start_processes(num_processes):
    processes = []
    for queue_url in queue_urls:
        for _ in range(num_processes):
            process = Process(target=process_messages, args=(queue_url,))
            processes.append(process)
            process.start()

    for process in processes:
        process.join()

if __name__ == '__main__':
    num_processes = 100
    start_time = time.time()
    start_processes(num_processes)
    end_time = time.time()

    print(f"Elapsed time: {end_time - start_time:.2f} seconds")

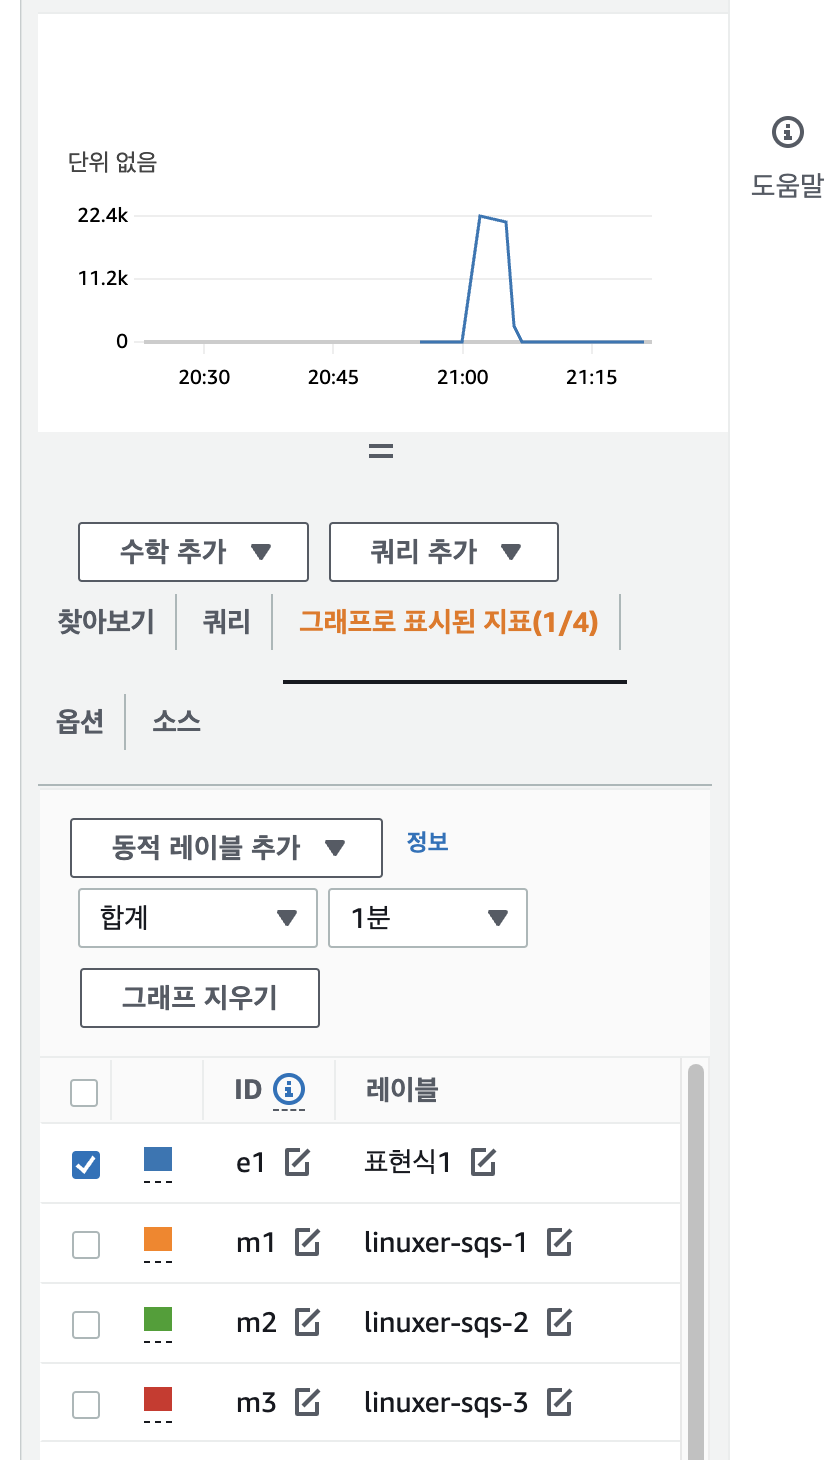
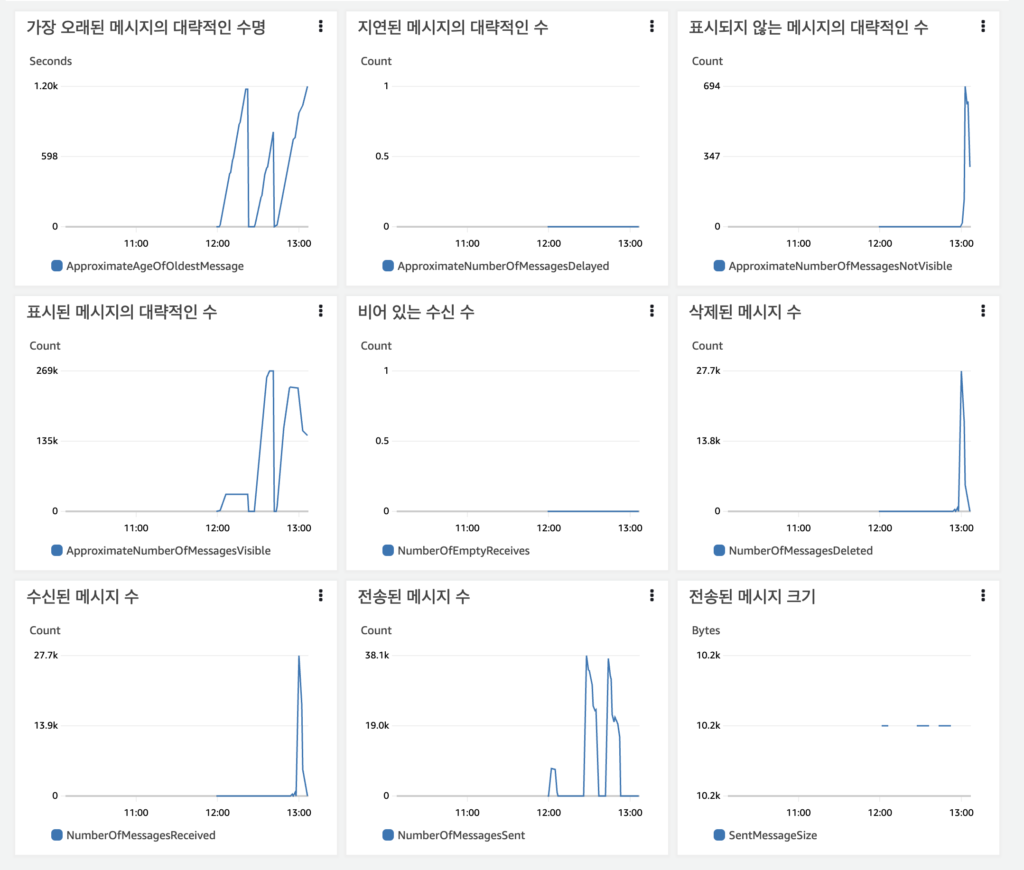
멀티프로세스 100개를 돌렸더니 M1이 뻣었다. 그렇지만 1분에 10만개 정도는 가볍게 뽑아가는걸 확인할수있었다.

이 결과만으로 SQS는 튼튼한 큐라는걸 알수 있었다. 그럼 이렇게 하드코어하게 넣었으니 에러레이트를 확인해 봐야했다.

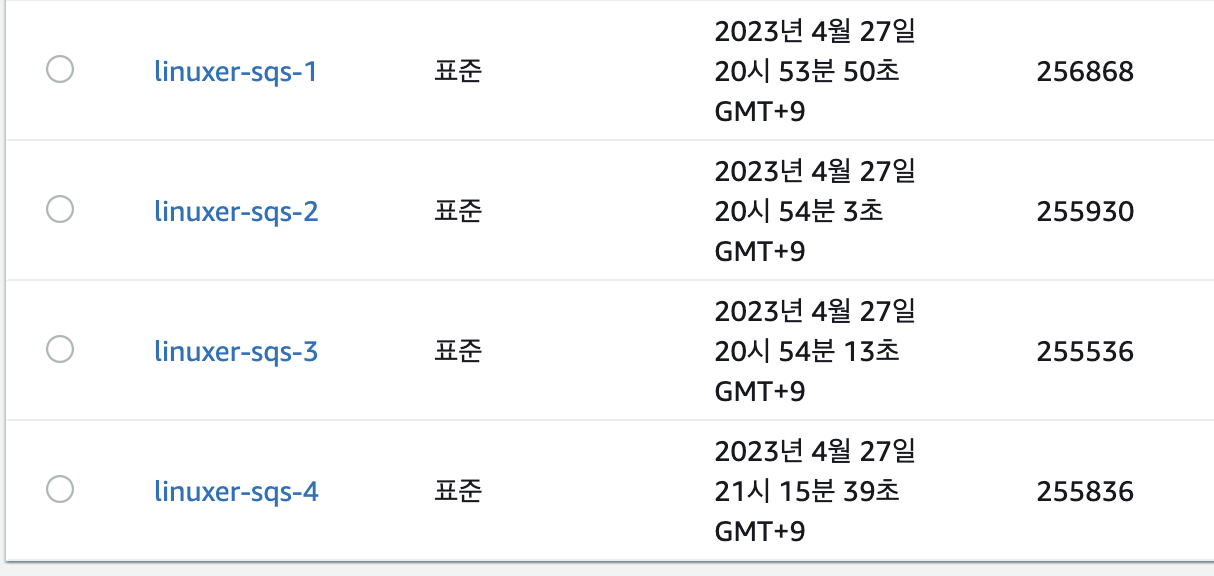
지연되거나 데드레터큐에 쌓인메시지는 없었다. 모두 정상적으로 소진된것이다.

여기서 결론은 mac book M1 air 로서 낼수 있는 퍼포먼스는 TPS1600이다. 분당 10만건의 메시지를 처리할수 있는 능력이라는것.. 이다음은 컴퓨팅 자원을 마음껏 넣어서 큐를 터트려 보겠다.

밤새 머리속에서 어떻게 하면 좋을까 고민하다가 EKS에서 Job을 이용해 병렬 처리속도를 늘려보기로 했다.

도커로 말고~

CMD로 job을 실행할때 파일을 지정해서 실행하도록 했다.

# Dockerfile
FROM python:3.8-slim

WORKDIR /app

COPY requirements.txt ./
RUN pip install --no-cache-dir -r requirements.txt

COPY send.py receive.py ./

CMD ["python", "receive.py"]
apiVersion: batch/v1
kind: Job
metadata:
  name: sqs-test
spec:
  parallelism: 20
  template:
    spec:
      containers:
      - name: sqs-test
        image: sqs_test:latest
        command: ["python3", "send.py"] // ["python", "receive.py"] 로 변경할수 있다.
        resources:
          limits:
            cpu: "2"
            memory: "2Gi"
          requests:
            cpu: "1500m"
            memory: "1Gi"
      restartPolicy: Never
  backoffLimit: 4

컨테이너 말고 parallelism 으로 20의 pod를 예약했다.

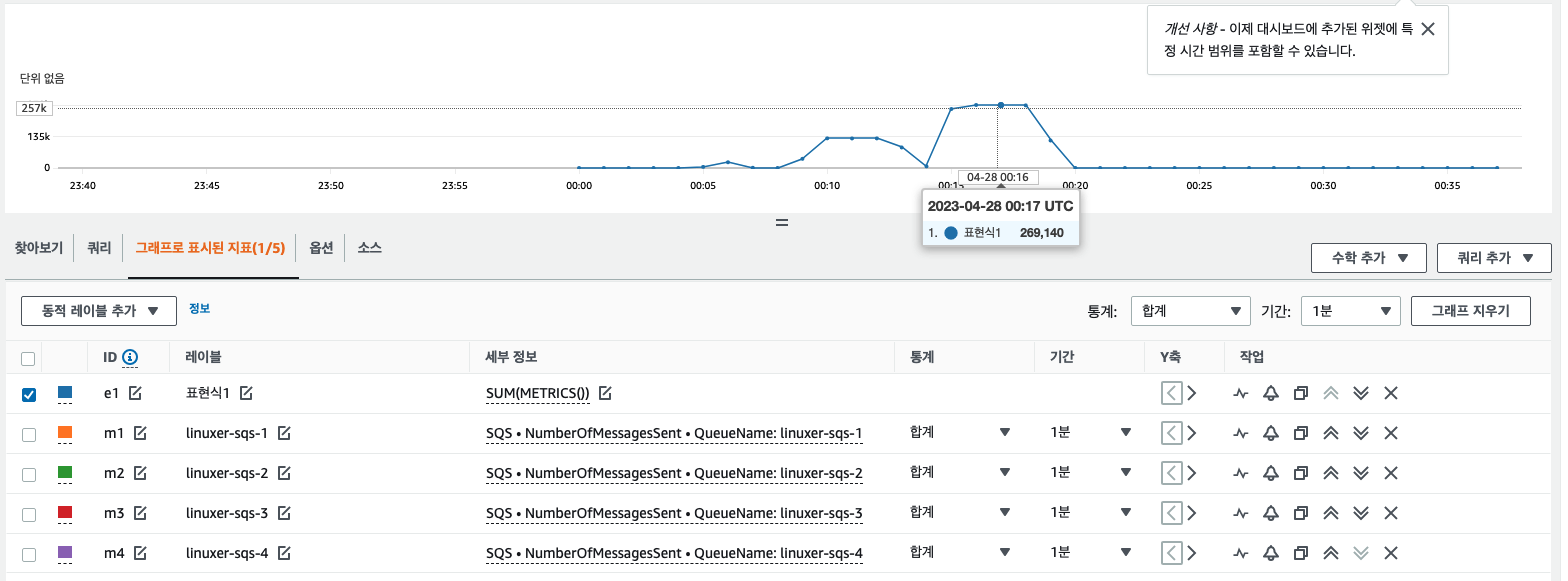
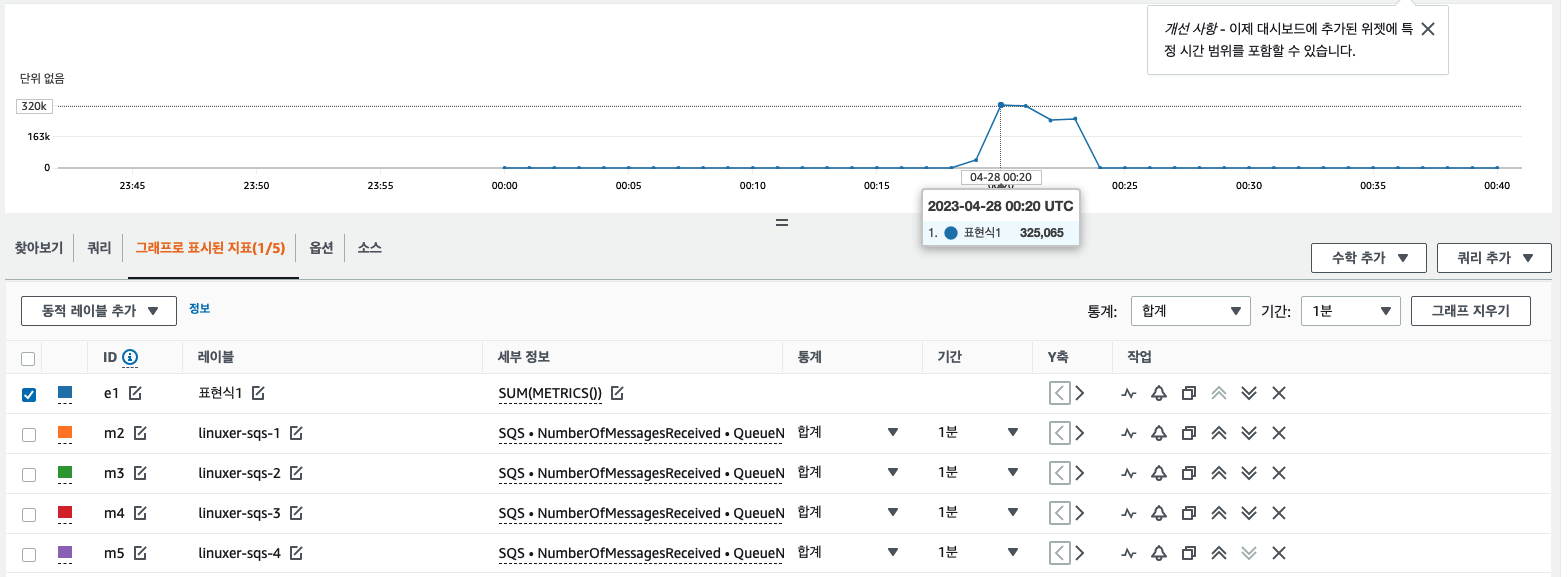
Send 는 분당 26만개 TPS 대략 4300

receive 는 32만개 대략 TPS 5000 정도이다.

5분에 100만개를 처리할수 있는 능력이라 보이고 이 플로우의 장점은 job에서 모든 데이터를 다꺼내쓰면 Completed로 컨테이너가 완료되므로 시간에 따른 큐에 대한 스케줄링이 가능하다는 뜻이다.

job을 스케줄링할때 큐에 쌓인 지연시간+큐에쌓인 갯수를 모니터링하고 job을 이용해 큐를 비우는 방식의 아키텍처를 설계할수 있다는 이야기다.

 k get pod
NAME                  READY   STATUS      RESTARTS   AGE
sqs-test-send-2s6h4   0/1     Completed   0          4m23s
sqs-test-send-5276z   0/1     Completed   0          4m23s
sqs-test-send-72ndr   0/1     Completed   0          4m22s
sqs-test-send-c24kn   0/1     Completed   0          4m22s
sqs-test-send-ccz5r   0/1     Completed   0          4m23s
sqs-test-send-fjfnk   0/1     Completed   0          4m23s
sqs-test-send-h2jhv   0/1     Completed   0          4m22s
sqs-test-send-k7b8q   0/1     Completed   0          4m22s
sqs-test-send-ljbv5   0/1     Completed   0          4m23s
sqs-test-send-mjvh9   0/1     Completed   0          4m23s
sqs-test-send-n8wh4   0/1     Completed   0          4m23s
sqs-test-send-ngskk   0/1     Completed   0          4m22s
sqs-test-send-qj9ks   0/1     Completed   0          4m22s
sqs-test-send-r87hf   0/1     Completed   0          4m22s
sqs-test-send-rr58h   0/1     Completed   0          4m23s
sqs-test-send-sf2bd   0/1     Completed   0          4m23s
sqs-test-send-svn8d   0/1     Completed   0          4m22s
sqs-test-send-tqfg4   0/1     Completed   0          4m23s
sqs-test-send-tv68j   0/1     Completed   0          4m22s
sqs-test-send-w99hx   0/1     Completed   0          4m23s

결과가 놀라운데 4분23초 만에 pod의 스케줄링+job(120만건의 메시징컨슘)이 모두 완료된건이다.

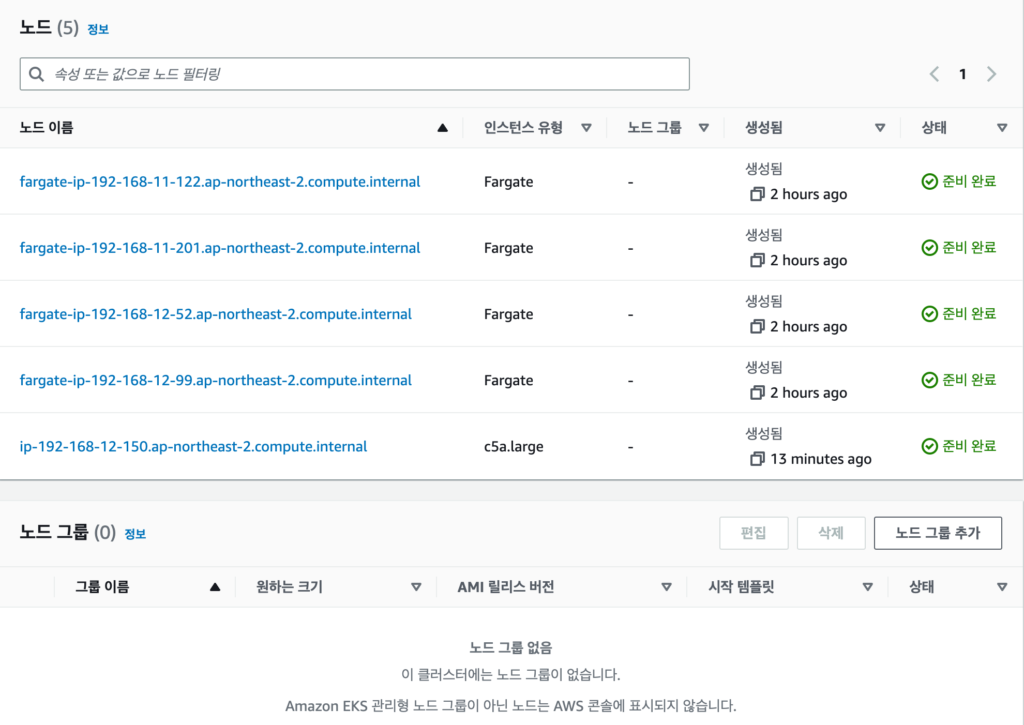
이아키텍처에는 카펜터가 사용되었는데, 카펜터의 노드는 0에서 시작하여 새로 노드를 프로비저닝해서 깔끔하게 모두 완료된것이다. 스케줄링이 놀랍다.

재미있는 테스트였다.

이다음은 KaFka를 테스트 하겠다.

CLOUDNET@ AWS네트워킹 강의 나눔이벤트

이번에 CLOUDNET@ 에서 인프런에 강의를 오픈했다.

https://inf.run/Xpv1

1호 영업사원으로 뛰기로 말한 전적이 있기에 추첨으로 강의 나눔 이벤트를 했

총 60분이 참여해주셨고, 간단하게 코드를 짰다.

import random

def select_random_winner(filename):
    with open(filename, 'r', encoding='utf-8') as file:
        names = file.readlines()

    winner = random.choice(names).strip()
    return winner

filename = "name_list.txt"
winner = select_random_winner(filename)
print(f"축하합니다! 상품 당첨자는 {winner}님입니다!")

랜덤으로 코드만들어서 돌렸다.

python3 select_random_winner.py
축하합니다! 상품 당첨자는 김신님입니다!

김신님께서 당첨되셨다.

축하합니다!

PKOS-5Week-Final!

마지막 주차이다.

5 주차는 보안 관련한 주제였다. 대표적으로 생각나는 쿠버네티스 보안 사건부터 이야기할까한다.

생각보다 많은 사람들이 쓰는 오픈소스중에 Rancher가 있다.

Rancher가 설치된 클러스터에서 이상한 증상이 발생했다. 배포된 POD가 재대로 성능이 나지않고 WorkerNode의 CPU사용율이 굉장히 높았다. 클러스터 외부에서 원인을 파악할 수 없어서 결국 WokerNode에 SSH를 접속해서 확인했었다.

WorkerNode에선 대량의 마이닝툴이 발견되었다. Pirvate 환경인데다가 외부에서 SSH도 불가능한 환경에서 발생한 침해사고라, 플랫폼의 문제로 대두되었다. 그러던 중 클러스터에서 동작중인 대시보드들을 확인하였다.

당시에는 다들 쿠버네티스에 익숙한 상황이 아니라서 확인이 좀오래 걸렸다.

실상은 사용자의 문제이지만, Rancher 에서 사용되는 privileged모드를 정확히 모르고 사용하여, Rancher 의 privileged 취약점을 통해 API로 손쉽게 대량의 마이닝툴을 인스톨 할수있는 이슈였다.

Rancher 2.4버전까진 privileged모드에 대한 안내가 없지만 2.5버전부턴 생겼다.

https://ranchermanager.docs.rancher.com/v2.5/pages-for-subheaders/rancher-on-a-single-node-with-docker#privileged-access-for-rancher-v25

가볍게 이전에 경험했던 이야기를 하면서 unsafe 에대한 이야기를 하려한다.

#kubelet --allowed-unsafe-sysctls 

에 대한 이야기다. 한창 K8S의 성능에 대한 고민이 많던 시기다.
이때에 쿠버네티스 네트워킹에 대해서 한창 많은 공부를 했던것 같다.

K8S의 성능이슈가 발생하였다. 흔히 말하는 쓰로틀링 이슈로 보틀넥이 되는 부분을 찾아야하는 상태였다. 증상은 이랬다. 일정이상의 트래픽이 발생하면 패킷이 드랍됬다.

이문제를 재현하는 것부터 시작했다. 최대한 많은 스트레스를 줘야했기에, 테스트 툴부터 시작했다. Locust를 선택했다. 가볍고 많은 트래픽을 만들수 있는 툴이다. Python 기반이라 테스트 스크립트 작성도 쉽다.

혹시나 같은 네트워크나 같은 클러스터등 다른 요인이 될만한 요소들을 최대한 제거해서 테스트했다. 이 테스트는 거의 2-3주 정도 진행했는데 테스트 결과가 너무 들쭉날쭉했다. 이유는 처음에 나는 CNI를 의심했다.

이유는 네트워크 이슈니까.

그런데 테스트를 진행할수록 CNI는 잘못이 없었다.
오히려 굉장히 최적화가 잘되어있다는 것을 알 수 있었다.

그 테스트를 진행하면서, 서버가 정상적으로 네트워크를 처리못하는 느낌이 들었다. 엔지니어 시절에는 커널파라 미터 튜닝도 은근 자주했기에 backlog / net.core.somaxconn 등을 의심했다.

net.core.netdev_max_backlog 옵션은 각 네트워크 별로 커널이 처리하도록 쌓아두는 Queue의 크기를 정해주는 파라미터다.

net.core.somaxconn 는 Listen backlog / Linsten 으로 바인딩된 서버 소켓에서 Accept를 기다리는 소캣 카운터의 하드리밋이다.

cat /var/lib/kubelet/kubelet.conf
apiVersion: kubelet.config.k8s.io/v1beta1
authentication:
  anonymous: {}
  webhook:
    cacheTTL: 0s
  x509: {}
authorization:
  webhook:
    cacheAuthorizedTTL: 0s
    cacheUnauthorizedTTL: 0s
cpuManagerReconcilePeriod: 0s
evictionPressureTransitionPeriod: 0s
fileCheckFrequency: 0s
httpCheckFrequency: 0s
imageMinimumGCAge: 0s
kind: KubeletConfiguration
logging:
  flushFrequency: 0
  options:
    json:
      infoBufferSize: "0"
  verbosity: 0
memorySwap: {}
nodeStatusReportFrequency: 0s
nodeStatusUpdateFrequency: 0s
runtimeRequestTimeout: 0s
shutdownGracePeriod: 0s
shutdownGracePeriodCriticalPods: 0s
streamingConnectionIdleTimeout: 0s
syncFrequency: 0s
volumeStatsAggPeriod: 0s

여기에 박아서 사용할수 있다.

allowed-unsafe-sysctls:
- net.core.netdev_max_backlog
- net.core.somaxconn

설정을 추가했다. 이제 프로세스를 새시작하고 테스트 했다.

32s                 Normal    NodeReady                 Node/i-0a7504d19e11fb642   Node i-0a7504d19e11fb642 status is now: NodeReady
31s                 Warning   SysctlForbidden           Pod/unsafe                 forbidden sysctl: "net.core.somaxconn" not allowlisted
14s (x6 over 30s)   Warning   FailedMount               Pod/unsafe                 MountVolume.SetUp failed for volume "kube-api-access-8w64p" : object "default"/"kube-root-ca.crt" not registered
4s                  Warning   SysctlForbidden           Pod/unsafe                 forbidden sysctl: "net.core.somaxconn" not allowlisted
4s                  Normal    Scheduled                 Pod/unsafe                 Successfully assigned default/unsafe to i-0a7504d19e11fb642

어라...이젠 이전에 했던 방법이 안먹는다. 그럼 뭐..더 고전적인 방법이다.

systemctl status kubelet.service 
● kubelet.service - Kubernetes Kubelet Server
     Loaded: loaded (/lib/systemd/system/kubelet.service; enabled; vendor preset: enabled)

보면 서비스 경로가 보인다. 이안에 kubelet을 시작하기 위한 경로들이 모여있다.

[Unit]
Description=Kubernetes Kubelet Server
Documentation=https://github.com/kubernetes/kubernetes
After=containerd.service

[Service]
EnvironmentFile=/etc/sysconfig/kubelet
ExecStart=/usr/local/bin/kubelet "$DAEMON_ARGS"
Restart=always
RestartSec=2s
StartLimitInterval=0
KillMode=process
User=root
CPUAccounting=true
MemoryAccounting=true

[Install]
WantedBy=multi-user.target

우린 /etc/sysconfig/kubelet 에 삽입하면 된다.

cat /etc/sysconfig/kubelet 
DAEMON_ARGS="--anonymous-auth=false --authentication-token-webhook=true --authorization-mode=Webhook --cgroup-driver=systemd --cgroup-root=/ --client-ca-file=/srv/kubernetes/ca.crt --cloud-provider=external --cluster-dns=169.254.20.10 --cluster-domain=cluster.local --enable-debugging-handlers=true --eviction-hard=memory.available<100Mi,nodefs.available<10%,nodefs.inodesFree<5%,imagefs.available<10%,imagefs.inodesFree<5% --feature-gates=CSIMigrationAWS=true,InTreePluginAWSUnregister=true --hostname-override=i-0a7504d19e11fb642 --kubeconfig=/var/lib/kubelet/kubeconfig --max-pods=100 --pod-infra-container-image=registry.k8s.io/pause:3.6@sha256:3d380ca8864549e74af4b29c10f9cb0956236dfb01c40ca076fb6c37253234db --pod-manifest-path=/etc/kubernetes/manifests --protect-kernel-defaults=true --register-schedulable=true --resolv-conf=/run/systemd/resolve/resolv.conf --v=2 --volume-plugin-dir=/usr/libexec/kubernetes/kubelet-plugins/volume/exec/ --cloud-config=/etc/kubernetes/in-tree-cloud.config --node-ip=172.30.52.244 --runtime-request-timeout=15m --container-runtime-endpoint=unix:///run/containerd/containerd.sock --tls-cert-file=/srv/kubernetes/kubelet-server.crt --tls-private-key-file=/srv/kubernetes/kubelet-server.key --config=/var/lib/kubelet/kubelet.conf"
HOME="/root"

여기 DAEMON_ARGS 뒤에 --allowed-unsafe-sysctls 'kernel.msg*,net.core.somaxconn' 를 추가해준다.

재시작 까지하면 프로세스에 추가된 파라미터가 보인다.

ps afxuwww | grep unsafe
root       27576  0.0  0.0   8168   656 pts/0    S+   13:07   0:00                          \_ grep --color=auto unsafe
root       27340  2.3  2.4 1789712 94144 ?       Ssl  13:06   0:00 /usr/local/bin/kubelet --anonymous-auth=false --authentication-token-webhook=true --authorization-mode=Webhook --cgroup-driver=systemd --cgroup-root=/ --client-ca-file=/srv/kubernetes/ca.crt --cloud-provider=external --cluster-dns=169.254.20.10 --cluster-domain=cluster.local --enable-debugging-handlers=true --eviction-hard=memory.available<100Mi,nodefs.available<10%,nodefs.inodesFree<5%,imagefs.available<10%,imagefs.inodesFree<5% --feature-gates=CSIMigrationAWS=true,InTreePluginAWSUnregister=true --hostname-override=i-0a7504d19e11fb642 --kubeconfig=/var/lib/kubelet/kubeconfig --max-pods=100 --pod-infra-container-image=registry.k8s.io/pause:3.6@sha256:3d380ca8864549e74af4b29c10f9cb0956236dfb01c40ca076fb6c37253234db --pod-manifest-path=/etc/kubernetes/manifests --protect-kernel-defaults=true --register-schedulable=true --resolv-conf=/run/systemd/resolve/resolv.conf --v=2 --volume-plugin-dir=/usr/libexec/kubernetes/kubelet-plugins/volume/exec/ --cloud-config=/etc/kubernetes/in-tree-cloud.config --node-ip=172.30.52.244 --runtime-request-timeout=15m --container-runtime-endpoint=unix:///run/containerd/containerd.sock --tls-cert-file=/srv/kubernetes/kubelet-server.crt --tls-private-key-file=/srv/kubernetes/kubelet-server.key --config=/var/lib/kubelet/kubelet.conf --allowed-unsafe-sysctls kernel.msg*,net.core.somaxconn
# k events 
5s                      Normal    NodeAllocatableEnforced   Node/i-0a7504d19e11fb642   Updated Node Allocatable limit across pods
4s                       Normal    Scheduled                 Pod/unsafe                 Successfully assigned default/unsafe to i-0a7504d19e11fb642
3s                       Normal    Pulling                   Pod/unsafe                 Pulling image "centos:7"
k get pod
NAME     READY   STATUS    RESTARTS   AGE
unsafe   1/1     Running   0          20s

정상적으로 스케줄링된것이 보인다.

이로서 unsafe 파라미터를 영구적으로 적용할수 있게되었다.

이렇게 파라미터를 적용하고 나서, net.core.somaxconn 을 테스트하였다. 정상적으로 적용된것이 보인다. 사실 단순히 somaxconn만 적용한다고 뭔가 달라지지 않는다. syn_backlog 값도 같이 늘려야 한다. 그리고 적용된 값은 Listen() 시스템 콜을 할때 적용 되기 때문에 이 파라미터 들은 컨테이너가 시작될때 적용된다고 보면 된다.

이런 과정을 거쳐서 테스트를 진행했으나, 실은 트래픽을 20% 더 받았을 뿐 증상이 완화 되지 않았다.

결국 해결은 kubenetes 안에 있지 않았고 Linux 안에 있었다. irqbalance의 smp_affinity 가 정상적으로 인터럽트 해주지 않아서 cpu0만 열심히 일하고 있었던 것이다.

이런과정에서 privileged / unsafe 에 대해서 알게되었다.

5주차 과정을 진행하면서 다시금 그때의 기억과 내용을 자세히 알게되면서 새로운 부분도 알되게었고, 새로이 정리도 하게되었다.

PKOS는 쿠버네티스의 전체적인 패턴과 컴포넌트들을 학습할수 있는 기회였다.

PKOS-4Week

이번주 스터디는 K8S에서의 Pometheus Grafana 다.

이글은 chatgpt를 이용해서 삽질하는 리눅서를 담고있다.

프로메테우스는 아이콘이 불꽃 모양인데 정말 모니터링계에 불을 가져다준 혁신과도 같은 존재다. 이전에는 Nagios / Zabbix가 나눠먹고 있었다.

나는 이번에 뭘 모니터링 해볼까 고민하다가 HPA를 모니터링 해볼까한다.

먼저 내가 요즘 일하는 방식을 보여줄까한다.

바로 Chatgpt다.

apiVersion: apps/v1
kind: Deployment
metadata:
  name: nginx-deployment
spec:
  replicas: 3
  selector:
    matchLabels:
      app: nginx
  template:
    metadata:
      labels:
        app: nginx
    spec:
      containers:
      - name: nginx
        image: nginx:1.21
        ports:
        - containerPort: 80
---
apiVersion: v1
kind: Service
metadata:
  name: nginx-service
spec:
  selector:
    app: nginx
  ports:
    - protocol: TCP
      port: 80
      targetPort: 80
  type: LoadBalancer
apiVersion: autoscaling/v2beta2
kind: HorizontalPodAutoscaler
metadata:
  name: nginx-hpa
spec:
  scaleTargetRef:
    apiVersion: apps/v1
    kind: Deployment
    name: nginx-deployment
  minReplicas: 3
  maxReplicas: 10
  metrics:
  - type: Resource
    resource:
      name: cpu
      target:
        type: Utilization
        averageUtilization: 50

https://github.com/rakyll/hey

go 기반이라 bash로 수정해달라고 했다.

#!/bin/bash

SERVICE_IP=$(kubectl get svc nginx-service -o jsonpath='{.status.loadBalancer.ingress[0].ip}')
CONCURRENCY=100
REQUESTS=50000

# Run load test
for i in $(seq 1 $CONCURRENCY); do
  (for j in $(seq 1 $(($REQUESTS / $CONCURRENCY))); do
    curl -s -o /dev/null http://${SERVICE_IP}/
  done) &
done

# Wait for all background processes to complete
wait

위의 Manifast 를 적용한 결과는 다음과 같다.

 k get all 
NAME                                    READY   STATUS    RESTARTS   AGE
pod/nginx-deployment-7c6895c677-cblrh   1/1     Running   0          15s
pod/nginx-deployment-7c6895c677-s6b5c   1/1     Running   0          15s
pod/nginx-deployment-7c6895c677-smkxv   1/1     Running   0          15s

NAME                    TYPE           CLUSTER-IP      EXTERNAL-IP   PORT(S)        AGE
service/nginx-service   LoadBalancer   100.66.65.216   <pending>     80:30979/TCP   15s

NAME                               READY   UP-TO-DATE   AVAILABLE   AGE
deployment.apps/nginx-deployment   3/3     3            3           15s

NAME                                          DESIRED   CURRENT   READY   AGE
replicaset.apps/nginx-deployment-7c6895c677   3         3         3       15s

NAME                                            REFERENCE                     TARGETS         MINPODS   MAXPODS   REPLICAS   AGE
horizontalpodautoscaler.autoscaling/nginx-hpa   Deployment/nginx-deployment   <unknown>/50%   3         10        3          19s

정말 잘동작한다.

이제 ingress 답변을 받았다.

apiVersion: networking.k8s.io/v1
kind: Ingress
metadata:
  name: my-ingress
  annotations:
    kubernetes.io/ingress.class: alb
    alb.ingress.kubernetes.io/scheme: internet-facing
spec:
  rules:
    - http:
        paths:
          - path: /
            pathType: Prefix
            backend:
              service:
                name: nginx-service
                port:
                  number: 80
k get ingress
NAME         CLASS    HOSTS   ADDRESS                                                                     PORTS   AGE
my-ingress   <none>   *       k8s-nginx-myingres-106681c1f1-1873214288.ap-northeast-2.elb.amazonaws.com   80      72s

ingress - svc - deployment - hpa 구조 같은건 이제 3분이면 나온다.

gpt가 알려준 스크립트중

kubectl get svc nginx-service -o jsonpath='{.status.loadBalancer.ingress[0].ip}'

부분을

kubectl get ingress my-ingress -o jsonpath='{.status.loadBalancer.ingress[0].hostname}'

다음과 같이 수정하였다.

curl k8s-nginx-myingres-106681c1f1-1873214288.ap-northeast-2.elb.amazonaws.com 
<!DOCTYPE html>
<html>
<head>
<title>Welcome to nginx!</title>
<style>
html { color-scheme: light dark; }
body { width: 35em; margin: 0 auto;
font-family: Tahoma, Verdana, Arial, sans-serif; }
</style>
</head>
<body>
<h1>Welcome to nginx!</h1>
<p>If you see this page, the nginx web server is successfully installed and
working. Further configuration is required.</p>

<p>For online documentation and support please refer to
<a href="http://nginx.org/">nginx.org</a>.<br/>
Commercial support is available at
<a href="http://nginx.com/">nginx.com</a>.</p>

<p><em>Thank you for using nginx.</em></p>
</body>
</html>

잘 뜬다.

이제 공격 간다

굉장한 스크립트 였다... 한방에 100개의 스크립트가 떴다...후....

근데 nginx 는 너무 가벼운 친구라...ㅠㅠ hpa 가 잘작동하지 않았다. 리미트를 준다.

        resources:
          limits:
            cpu: 15m
            memory: 10Mi
          requests:
            cpu: 15m
            memory: 10Mi
            
k get hpa
NAME        REFERENCE                     TARGETS   MINPODS   MAXPODS   REPLICAS   AGE
nginx-hpa   Deployment/nginx-deployment   33%/50%   3         10        3          25m

좋다 적절하다.

이제 셋업은 다되었다. hpa 가 동작하는 대시보드와 hap 가 일정이상 동작해서 max 에 가 까워지면 알럿을 날릴거다.

Chatgpt에게 물었고, 비슷한 쿼리를 작성했다.

kube_horizontalpodautoscaler_status_desired_replicas{horizontalpodautoscaler="nginx-hpa", namespace="nginx"}

결과는 잘 작동한다. 그럼이걸 알럿을 보낼거다.

프로메테우스에서 graph로 grafana 에서 가져온 쿼리를 넣는다

1- avg(rate(kube_horizontalpodautoscaler_status_desired_replicas{horizontalpodautoscaler="nginx-hpa", namespace="nginx"}[1m]))

 k edit cm prometheus-kube-prometheus-stack-prometheus-rulefiles-0
configmap/prometheus-kube-prometheus-stack-prometheus-rulefiles-0 edited

edit 로 수정했다.

추가를 하다가 잘 안되서 helm에 있는 config를 뜯어봤다. 어떤구성인지,

     containers:
      - env:
        - name: BITNAMI_DEBUG
          value: "false"
        - name: NGINX_HTTP_PORT_NUMBER
          value: "8080"
        image: docker.io/bitnami/nginx:1.23.3-debian-11-r17
        imagePullPolicy: IfNotPresent
        livenessProbe:
          failureThreshold: 6
          initialDelaySeconds: 30
          periodSeconds: 10
          successThreshold: 1
          tcpSocket:
            port: http
          timeoutSeconds: 5
        name: nginx
        ports:
        - containerPort: 8080
          name: http
          protocol: TCP
        readinessProbe:
          failureThreshold: 3
          initialDelaySeconds: 5
          periodSeconds: 5
          successThreshold: 1
          tcpSocket:
            port: http
          timeoutSeconds: 3
        resources: {}
        terminationMessagePath: /dev/termination-log
        terminationMessagePolicy: File
      - command:
        - /usr/bin/exporter
        - -nginx.scrape-uri
        - http://127.0.0.1:8080/status
        image: docker.io/bitnami/nginx-exporter:0.11.0-debian-11-r44
        imagePullPolicy: IfNotPresent
        livenessProbe:
          failureThreshold: 3
          httpGet:
            path: /metrics
            port: metrics
            scheme: HTTP
          initialDelaySeconds: 15
          periodSeconds: 10
          successThreshold: 1
          timeoutSeconds: 5
        name: metrics
        ports:
        - containerPort: 9113
          name: metrics
          protocol: TCP
        readinessProbe:
          failureThreshold: 3
          httpGet:
            path: /metrics
            port: metrics
            scheme: HTTP
          initialDelaySeconds: 5
          periodSeconds: 10
          successThreshold: 1
          timeoutSeconds: 1
        resources: {}
        terminationMessagePath: /dev/termination-log
        terminationMessagePolicy: File
      dnsPolicy: ClusterFirst
      restartPolicy: Always
      schedulerName: default-scheduler
      securityContext: {}
      serviceAccount: default
      serviceAccountName: default
      shareProcessNamespace: false
      terminationGracePeriodSeconds: 30

exporter 가 사이드카로 붙어서 모니터링을 하고있었다.

https://github.com/nginxinc/nginx-prometheus-exporter

온종일 삽질의 연속이다가 오늘또 k8s에서의 프로메테우스와 그라파나 패턴을 까보면서 helm을 써야할까 하는 고민이들었다. kustomize를 고민했는데 좀더 뭘깍을지 생각해봐야겠다.

Argo-WorkFlow/Events

이글은 Argo WorkFlow로 CI를 하려했던 나의 경험담을 담고있다.

Argo WorkFlow를 쓰려고 결심하고 리서칭하는 중이라면 AirFlow가 있다. 돌아가라.

Argo WorkFlow는 Flow마다 Pod를 생성한다. 그대가 원하는 패턴이 맞는지 다시한번 생각하라. 매 Flow 마다 Pod가 만들어 지는것이 맞는가? 그렇다면 맞다 Argo WorkFlow 다.

그럼다면 다시 묻는다 CI를 위해서 Argo를 찾는것인가? K8S에서 다양한 CRD에 익숙하고 강력한 러닝커브는 즐거움으로 생각되고 CNCF에 기여하는게 꿈이라면 말리지 않겠다. 잘왔다. Argo WorkFlow/Events다.

이 글에선 CI를 다룬다. 물론 글이 깊진 않다. 하지만 찍먹으론 충분한 수준으로 그대에게 전달할 것이다. 먼저 Argo-WorkFlow 를 설치해야한다.

Argo 를 이용한 CI의 길은 친절하지 않다. 먼저 WorkFlow 설치는 이렇다.

https://github.com/argoproj/argo-workflows/releases/download/v3.4.5/install.yaml

다운 받는다.

https://argoproj.github.io/argo-workflows/quick-start/

에는 포트포워딩을 하는 방식이지만 우리는 Ingress 를 이용할거다. 그러기 위해선 install.yaml을 수정해야한다.

친절하게 하나하나 다설명하고 싶지만 내 의욕이 그렇게 길지 않기 때문에 대충 설명하겠다.

https://github.com/Cloud-Linuxer/Argo-test/blob/main/Argo-WorkFlow-install.yaml

이파일을 다운받던가 아래처럼 수정하자.

1257 / 1258 라인을 을 추가해야한다. 그래야 백엔드가 HTTP로 동작하고 인증모드가 서버로 동작한다 혹시 쓰고싶다면 sso 를 붙여야한다.

k create ns argo
k apply -f Argo-WorkFlow-install.yaml 
customresourcedefinition.apiextensions.k8s.io/clusterworkflowtemplates.argoproj.io created
customresourcedefinition.apiextensions.k8s.io/cronworkflows.argoproj.io created
customresourcedefinition.apiextensions.k8s.io/workflowartifactgctasks.argoproj.io created
customresourcedefinition.apiextensions.k8s.io/workfloweventbindings.argoproj.io created
customresourcedefinition.apiextensions.k8s.io/workflows.argoproj.io created
customresourcedefinition.apiextensions.k8s.io/workflowtaskresults.argoproj.io created
customresourcedefinition.apiextensions.k8s.io/workflowtasksets.argoproj.io created
customresourcedefinition.apiextensions.k8s.io/workflowtemplates.argoproj.io created
serviceaccount/argo created
serviceaccount/argo-server created
role.rbac.authorization.k8s.io/argo-role created
clusterrole.rbac.authorization.k8s.io/argo-aggregate-to-admin created
clusterrole.rbac.authorization.k8s.io/argo-aggregate-to-edit created
clusterrole.rbac.authorization.k8s.io/argo-aggregate-to-view created
clusterrole.rbac.authorization.k8s.io/argo-cluster-role created
clusterrole.rbac.authorization.k8s.io/argo-server-cluster-role created
rolebinding.rbac.authorization.k8s.io/argo-binding created
clusterrolebinding.rbac.authorization.k8s.io/argo-binding created
clusterrolebinding.rbac.authorization.k8s.io/argo-server-binding created
configmap/workflow-controller-configmap created
service/argo-server created
priorityclass.scheduling.k8s.io/workflow-controller created
deployment.apps/argo-server created
deployment.apps/workflow-controller created

CRD부터 SA role 등등 마지막으로 2개의 deployment를 만든다. 그럼 내가 추가한 설정이 잘추가 됬는 지 확인하고 싶다면 argo-server 의 시작 로그를 확인한다.

k logs argo-server-5779fd7868-nb77l 
time="2023-03-21T12:56:22.411Z" level=info msg="not enabling pprof debug endpoints"
time="2023-03-21T12:56:22.411Z" level=info authModes="[server]" baseHRef=/ managedNamespace= namespace=argo secure=false ssoNamespace=argo
time="2023-03-21T12:56:22.412Z" level=warning msg="You are running in insecure mode. Learn how to enable transport layer security: https://argoproj.github.io/argo-workflows/tls/"
time="2023-03-21T12:56:22.412Z" level=warning msg="You are running without client authentication. Learn how to enable client authentication: https://argoproj.github.io/argo-workflows/argo-server-auth-mode/"
time="2023-03-21T12:56:22.412Z" level=info msg="SSO disabled"
time="2023-03-21T12:56:22.422Z" level=info msg="Starting Argo Server" instanceID= version=v3.4.5
time="2023-03-21T12:56:22.422Z" level=info msg="Creating event controller" asyncDispatch=false operationQueueSize=16 workerCount=4
time="2023-03-21T12:56:22.425Z" level=info msg="GRPC Server Max Message Size, MaxGRPCMessageSize, is set" GRPC_MESSAGE_SIZE=104857600
time="2023-03-21T12:56:22.425Z" level=info msg="Argo Server started successfully on http://localhost:2746" url="http://localhost:2746"

automode 에 [server] 이 들어가있다면 정상적으로 먹은거다. 기본이 Clinet다. 그리고 서버 시작로그에 url 에 https 가 아니라 http 면 백엔드가 http 인거다.

여기까지 하면 이제 WorkFlow를 사용할 준비가 아직 안된거다. 이건 단순히 컨트롤러와 argo-server UI까지만 설치한거다.

우리는 이제 왜 내글의 제목이 Argo-WorkFlow/Events 인지 알게 된다.

Argo 프로젝트로 CI를 하기위해선 WF만으로는 할수없다. Events 를 써야한다.

https://github.com/Cloud-Linuxer/Argo-test/blob/main/Argo-Events-install.yaml

원래 Argo-WorkFlow 와 Argo-Events 는 namespace로 분리되어있지만 나는 이 CRD의 지저분함을 견딜수없어서 argo namespace 하나로 구성했다 Argo-Events-install.yaml 파일은 namespace를 수정한 파일이다.

 k apply -f Argo-Events-install.yaml 
customresourcedefinition.apiextensions.k8s.io/eventbus.argoproj.io created
customresourcedefinition.apiextensions.k8s.io/eventsources.argoproj.io created
customresourcedefinition.apiextensions.k8s.io/sensors.argoproj.io created
serviceaccount/argo-events-sa created
clusterrole.rbac.authorization.k8s.io/argo-events-aggregate-to-admin created
clusterrole.rbac.authorization.k8s.io/argo-events-aggregate-to-edit created
clusterrole.rbac.authorization.k8s.io/argo-events-aggregate-to-view created
clusterrole.rbac.authorization.k8s.io/argo-events-role created
clusterrolebinding.rbac.authorization.k8s.io/argo-events-binding created
configmap/argo-events-controller-config created
deployment.apps/controller-manager created

https://github.com/Cloud-Linuxer/Argo-test/blob/main/Argo-EventsBus.yaml

이벤트 버스는 Argo-Event 를 하면서 가장 인상적인 아키텍처였다.

k apply -f Argo-EventsBus.yaml 
eventbus.argoproj.io/default created

이유는 이렇다.

 k get pod
NAME                                  READY   STATUS    RESTARTS   AGE
argo-server-5779fd7868-nb77l          0/1     Running   0          25m
controller-manager-78bbd4559b-sd28w   1/1     Running   0          3m53s
eventbus-default-stan-0               2/2     Running   0          72s
eventbus-default-stan-1               2/2     Running   0          63s
eventbus-default-stan-2               2/2     Running   0          54s
workflow-controller-5f7f4d8-96bnm     1/1     Running   0          25m

세개의 이벤트 버스가 pod 로 뜨고,

https://argoproj.github.io/argo-events/concepts/architecture/

event source와 sonser 사이에서 버스역할을 하는 pod 가 있는것이었다.

여기까지 왔다면, 이제 Argo-WorkFlow/Events 를 사용할 준비가 완료된것이다.

그럼 한번 Ingress 를 배포해보자

https://github.com/Cloud-Linuxer/Argo-test/blob/main/Argo-Server-Ingress.yaml

apiVersion: networking.k8s.io/v1
kind: Ingress
metadata:
  name: argo-ingress
  annotations:
    alb.ingress.kubernetes.io/scheme: internet-facing
    alb.ingress.kubernetes.io/target-type: ip
    alb.ingress.kubernetes.io/listen-ports: '[{"HTTP": 80}]'
    alb.ingress.kubernetes.io/security-groups: sg-0cd215a1ea38d94bf
    alb.ingress.kubernetes.io/subnets: subnet-0b00bab5bde81c736,subnet-0928ee0c6eaaecea2
    alb.ingress.kubernetes.io/backend-protocol: HTTP
    alb.ingress.kubernetes.io/healthcheck-protocol: HTTP
    alb.ingress.kubernetes.io/healthcheck-path: /
spec:
  ingressClassName: alb
  rules:
    - http:
        paths:
        - path: /
          pathType: Prefix
          backend:
            service:
              name: argo-server
              port:
                number: 2746

어차피 보안그룹 서브넷만 수정해서 넣자. 바로된다. 만약안되면 pod가 존재하는 node의 보안그룹에 2746포트를 열지않아서 그렇다. 열어주자.

그러면 꼴뚜기 친구를 볼수있다. 이제 WorkFlow UI 까지 띄우고 Events 를 사용할 준비가 마무리 된거다.

git webhook을 이용한 간단한 테스트 정도만 이어 갈거다 걱정하지 마라. 먼저 알아야 할것은 workflow / Events 라는 놈은 CRD를 떡칠해 놨기에 우리가 생각하는 K8S의 컴포넌트 동작과는 다르다. K8S의 컴포넌트를 이용하긴 하나, 받아서 던져주는 EventBus 같은녀석도 있기때문에 Ingress 가 정상적으로 동작해도 Bus를 탈수없는 경우도 있다.

그럼 Events 로 가기전에 CRD의 RBAC를 설치해야 한다.

 # sensor rbac
k apply -f https://raw.githubusercontent.com/argoproj/argo-events/master/examples/rbac/sensor-rbac.yaml
 # workflow rbac
k apply -f https://raw.githubusercontent.com/argoproj/argo-events/master/examples/rbac/workflow-rbac.yaml

나는 이 RBAC를 적용하면서 사실 살짝 현타가 왔다. CRD의 모든 동작을 알순없더라도 적어도 내가 통제할수는 있는 레벨이어야 하는데 너무 쪼개진 컴포넌트 들이 나를 힘들게 했다.

자 그럼 이제 이벤트소스-웹훅-센서-트리거 를 배포해 보자.

사실 엄청 거창해 보이지만 yaml 로는 두개다.

https://github.com/Cloud-Linuxer/Argo-test/blob/main/Argo-EventSource.yaml

apiVersion: argoproj.io/v1alpha1
kind: EventSource
metadata:
  name: webhook
spec:
  service:
    ports:
      - port: 12000
        targetPort: 12000
  webhook:
    example:
      port: "12000"
      endpoint: /
      method: POST

EventSource 의 yaml 은 하나지만 CRD라 Service 와 Pod를 배포해준다.

 k get all -l eventsource-name=webhook
NAME                                             READY   STATUS    RESTARTS   AGE
pod/webhook-eventsource-r7x58-8575c749bb-fsjnf   1/1     Running   0          6m

NAME                              TYPE        CLUSTER-IP       EXTERNAL-IP   PORT(S)     AGE
service/webhook-eventsource-svc   ClusterIP   100.64.116.226   <none>        12000/TCP   6m

k get eventsources.argoproj.io 
NAME      AGE
webhook   10m

eventsource-name=webhook label 이 붙는다. owner나 이런 저런것도 붙는다.

그럼 이제 Sonser를 배포할거다. 이벤트소스를 통해 전달받은 웹훅을 센서가 받아서 트리거를 호출하고 실행한다.

https://github.com/Cloud-Linuxer/Argo-test/blob/main/Argo-Sensor-Webhook.yaml

k apply -f Argo-Sensor-Webhook.yaml 
sensor.argoproj.io/webhook created

배포가 완료되면

이렇게 Argo WorkFlow UI에서 확인할수 있다.
그럼 웹훅까지 발생시켜 보자.

웹훅도 Ingress 로 받을 거다.

k get svc
NAME                        TYPE        CLUSTER-IP       EXTERNAL-IP   PORT(S)                      AGE
argo-server                 ClusterIP   100.68.95.174    <none>        2746/TCP                     37m
eventbus-default-stan-svc   ClusterIP   None             <none>        4222/TCP,6222/TCP,8222/TCP   64m
webhook-eventsource-svc     ClusterIP   100.64.116.226   <none>        12000/TCP                    14m

Service를 보면 webhook-eventsource-svc Eventsource 가 있다. 이걸 Ingress 로 연결해야한다. Ingress 를 생성하면 이런식으로 두개의 Ingress 가 생긴다.

k get ingress
NAME                       CLASS   HOSTS   ADDRESS                                                                    PORTS   AGE
argo-eventsource-ingress   alb     *       k8s-argo-argoeven-44fe46d880-57919429.ap-northeast-2.elb.amazonaws.com     80      26s
argo-ingress               alb     *       k8s-argo-argoingr-17062136f1-1802335500.ap-northeast-2.elb.amazonaws.com   80      44m

그럼 argo-eventsource-ingress 쪽으로 웹훅을 날려보자.

curl -d '{"message":"this is my first webhook"}' -H "Content-Type: application/json" -X POST http://k8s-argo-argoeven-44fe46d880-57919429.ap-northeast-2.elb.amazonaws.com
success

success가 떨어질것이다. 그럼 정상적으로 실행됬는지 UI에서 확인해보자.

WorkFlow가 생성된게 보인다. 그럼 이걸 CLI 에서도 확인해보자.
k get wf
NAME            STATUS      AGE   MESSAGE
webhook-9vzcz   Succeeded   88s   

정상적으로 완료됬다. 그럼 대량의 웹훅을 날린다면???

헤헤 주거라 WorkFlow!!!!!!!!!!!!!!!!!!!!!!!!!!!!!

대량으로 생성된걸 확인할수 있다. 이때 pod는?

k get pod | grep webhook
webhook-4j9gq                                0/2     Completed   0          108s
webhook-4q646                                0/2     Completed   0          101s
webhook-6k44h                                0/2     Completed   0          96s
webhook-96w4x                                0/2     Completed   0          106s
webhook-9vzcz                                0/2     Completed   0          3m58s
webhook-blmsq                                0/2     Completed   0          107s
webhook-eventsource-r7x58-8575c749bb-fsjnf   1/1     Running     0          26m
webhook-fq6d5                                0/2     Completed   0          102s
webhook-fzh2t                                0/2     Completed   0          103s
webhook-g58r9                                0/2     Completed   0          103s
webhook-gk9wb                                0/2     Completed   0          98s
webhook-mh6b2                                0/2     Completed   0          104s
webhook-mm9qx                                0/2     Completed   0          105s
webhook-n9x4k                                0/2     Completed   0          106s
webhook-nhd8l                                0/2     Completed   0          109s
webhook-ps8z6                                0/2     Completed   0          109s
webhook-qnnbd                                0/2     Completed   0          100s
webhook-qrm8d                                0/2     Completed   0          97s
webhook-rcztl                                0/2     Completed   0          98s
webhook-sensor-lqv7w-6459d75dbb-xlkh8        1/1     Running     0          13m
webhook-vs2tm                                0/2     Completed   0          99s
webhook-xtfbh                                0/2     Completed   0          104s
webhook-z6twq                                0/2     Completed   0          108s

늘어난다.

나는 이다음 github webhook과 인증인가 Ingress 보호등 다양한 부분을 확인하고 테스트했다. 그이후엔 셀프로 이걸 관리하면서 사용할거라면 안하는게 맞다는 결론을 내렸다.

여러분도 Workflow를 적용하려 한다면 고충이 클것이다.

이포스팅이 여러분의 앞날에 삽질을 줄여주길 바란다. 이만!